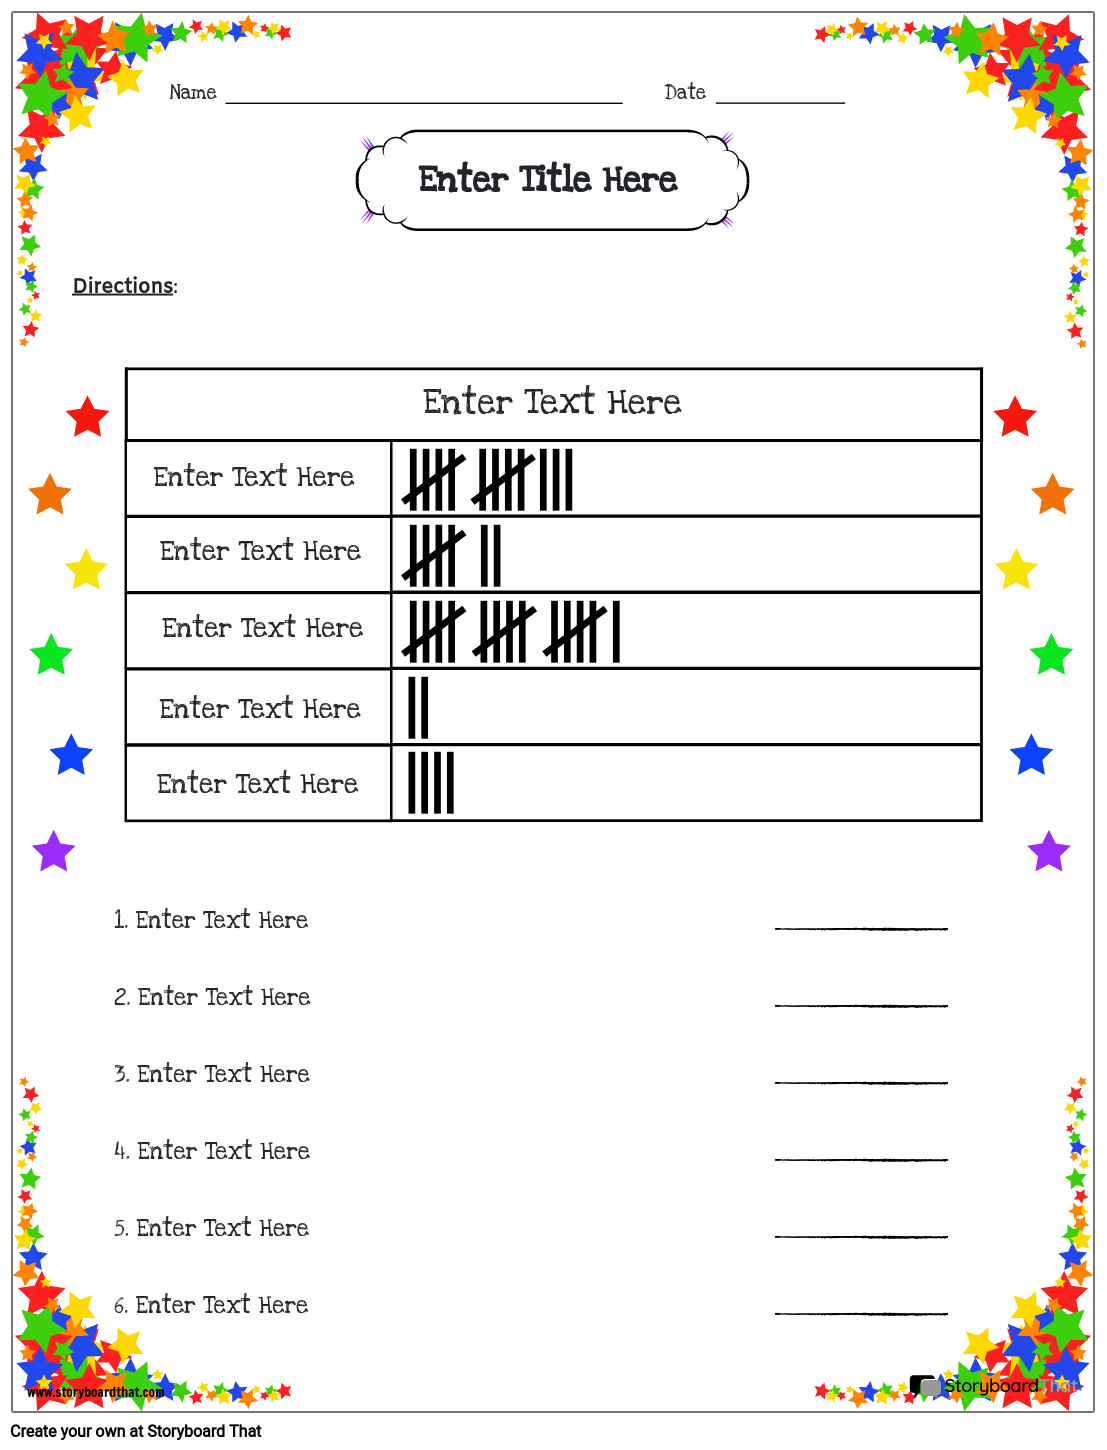
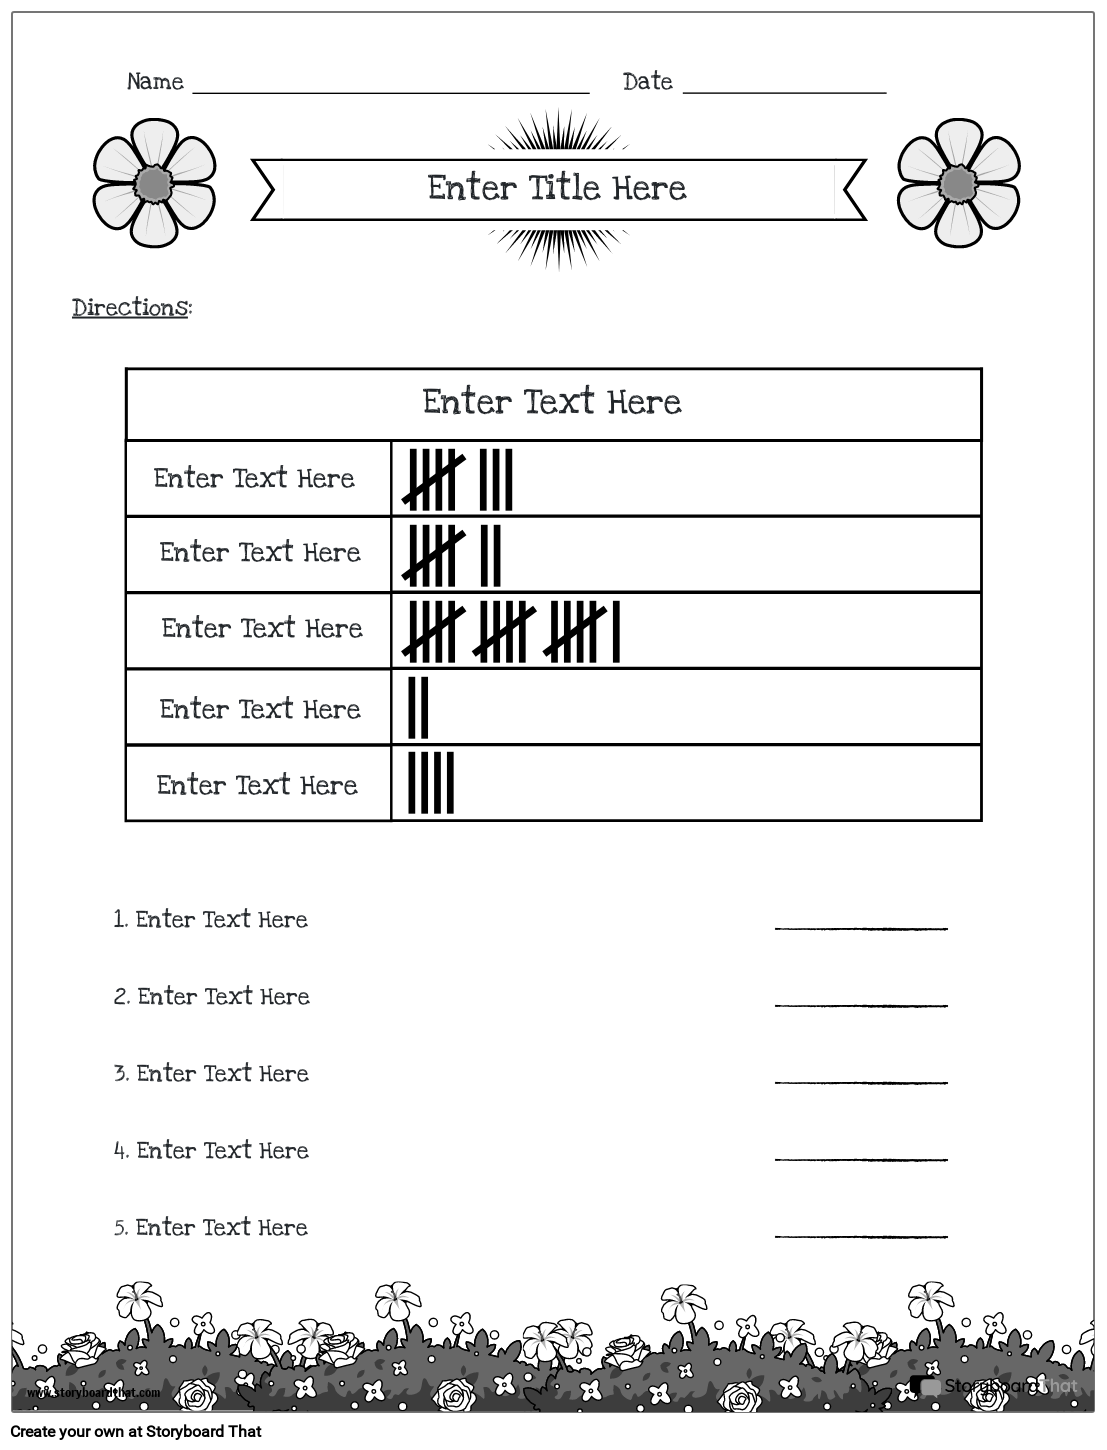
Customize Tally Chart Worksheets
If you're assigning this to your students, copy the worksheet to your account and save. When creating an assignment, just select it as a template!

What is a Tally Chart?
It is a visual tool for counting and recording data, utilizing tally marks (vertical lines) to represent quantities. These marks simplify counting, with a diagonal line added every fifth mark. To draw tally marks on a tally sheet involves representing items with individual marks and using a diagonal line for groups of five. This streamlined method aids data interpretation and comparison. Incorporating these with other interactive tools enhances practice counting, transforming it into engaging learning.
How to Use a Tally Chart Template in Your Class: Engaging Activities for All Ages
These charts are not only about numbers; they're a stepping stone to understanding data and making informed decisions. When you use a Storyboard That blank tally chart template, you have a versatile tool to design engaging activities that cater to students of all grade levels. Let's explore some specific activities that can transform your classroom into a hub of meaningful learning when graphing data.
- Count and Create: Kindergarten and 1st Grade Tally Exploration: For this young level, counting is an exciting adventure. Use Storyboard That's worksheets to make an activity where kids count objects—like colored beads, toys, or classroom items. They can then represent their counts using tally marks on the page, helping them understand the concept of tallying and laying the foundation for future data interpretation.
- Categorize and Compare: Elementary Graphing Fun: As students progress, tally charts evolve into more complex graphing activities. Provide them with worksheets that have categories such as favorite ice cream flavors. Kids gather answers from their classmates to form a data set, create tally marks, and then transform their tallies into bar graphs, circle graphs, or even a pictograph! This activity not only enhances counting tallies but also introduces the concept of comparison and visualization.
- Survey and Analyze: Middle School Data Insights: Middle schoolers are ready for deeper analysis. Have them conduct surveys on topics of interest, such as hobbies or movie preferences. Using Storyboard That's worksheets, students organize their data into categories, count tallies, and then transition these counts into a tally graph or table. This activity nurtures data literacy skills and encourages students to draw meaningful insights from collected information.
- Real-World Application: High School Data Interpretation: For high school students, templates become a bridge to real-world scenarios. Provide them with data sets related to social issues, consumer preferences, or scientific observations. Challenge students to make detailed charts and transform them into visually appealing picture graphs. This activity sharpens their analytical thinking and equips them with skills necessary for interpreting complex data.
- Storytelling with Data: Creative Insights Across Grades: Engage students' creativity by using our tally marks generator to tell a data-driven story. Assign each student a different topic—whether it's animal preferences, travel destinations, or book genres. Students gather data, create tally charts, and construct narratives based on their findings. This activity fosters a deep connection between data and real-life scenarios, enhancing both analytical and communication skills.
- Tally Marks Worksheets: Reinforcing Fundamentals: Integrate tally graphs into your activities to reinforce counting skills. After completing activities, kids can answer the worksheets to practice writing tally marks for various numbers. This additional practice solidifies their understanding of tallying and prepares them for more advanced graphing tasks such as a bar graph or a table.
As children engage with tally charts, they build essential data literacy skills. Once they've mastered this skill, they can explore other valuable resources such as the table chart template and the circle chart template. These tools empower them to represent information in different formats, expanding their analytical abilities. Moving beyond counting, they can delve into mathematical concepts such as subtraction with our subtraction worksheets and multiplication with our multiplication worksheets, bridging the gap between data interpretation and arithmetic problem-solving.
Creating Tally Charts with Our Tally Chart Maker
Unleash the potential of data visualization with our innovative tally chart maker. Whether you're an educator, student, or data enthusiast, our user-friendly tool will help you create tally charts online free and effortlessly. Using our worksheets, transform raw data into captivating visual representations, enhancing counting skills, data organization, and interpretation.
Step 1: Access the Tally Chart Creator
Begin your journey by accessing our Tally Chart Creator, your virtual canvas for creative data visualization. Whether you're a seasoned pro or a novice, this tool caters to all levels of expertise, making chart creation accessible and enjoyable.
Step 2: Choose Your Template
Select the template that aligns with your data and goals. Our variety includes blank tally chart templates, providing a structured starting point to streamline your chart creation process.
Step 3: Customize to Perfection
Flex your creative muscles by customizing your tally chart. From colors to fonts, tailor the aesthetics to resonate with your audience. Personalization adds a unique touch to your data presentation.
Step 4: Preview and Refine
Before finalizing, utilize the preview feature to ensure your tally chart meets your expectations. Take this opportunity to refine any elements, guaranteeing a polished and professional result.
Step 5: Save and Share
With your tally chart perfected, save your creation in various formats. Our tally chart maker accommodates diverse sharing options, facilitating seamless integration into presentations, assignments, or discussions.
Our tally chart maker facilitates a seamless transition from data to visuals. Whether you're creating a tally chart for kids to nurture counting skills or crafting complex presentations, this tool saves time and enhances the educational experience. Dive into data visualization with confidence, embracing creativity to transform raw data into captivating narratives. Elevate your teaching and learning journey by turning statistics into stories that resonate.
How to Make a Tally Chart Worksheet
Choose One of the Premade Templates
We have lots of templates to choose from. Take a look at our example for inspiration!
Click on “Copy Template”
Once you do this, you will be directed to the storyboard creator.
Give Your Worksheet a Name!
Be sure to call it something related to the topic so that you can easily find it in the future.
Edit Your Worksheet
This is where you will include directions, specific images, and make any aesthetic changes that you would like. The options are endless!
Click "Save and Exit"
When you are finished, click this button in the lower right hand corner to exit your storyboard.
Next Steps
From here you can print, download as a PDF, attach it to an assignment and use it digitally, and more!
Happy Creating!
Frequently Asked Questions About Tally Chart Worksheets
What are tally marks worksheets?
Tally marks worksheets are educational resources designed to help learners practice and understand tally marks. These worksheets offer interactive exercises where students can create tally marks based on provided data, improving their counting skills and familiarity with data representation.
Where can I find a tally chart creator?
Storyboard That offers a tally chart creator as part of its interactive tools. This feature enables users to design and generate tally charts easily. You can input your data and customize the appearance of the chart to suit your needs.
Are tally marks worksheets suitable for all ages?
Yes, Storyboard That's tally marks worksheets are adaptable to different age groups and skill levels. These worksheets are especially beneficial for introducing counting concepts to young learners and reinforcing data representation skills in older students.
Where can I access a reliable tally chart generator online?
You can access Storyboard That's tally chart creator and generator on their official website. Their platform is designed to provide educators and learners with interactive tools for data visualization, ensuring a reliable and engaging experience for all users.
© 2025 - Clever Prototypes, LLC - All rights reserved.
StoryboardThat is a trademark of Clever Prototypes, LLC, and Registered in U.S. Patent and Trademark Office


