Customize T-Chart Templates
If you're assigning this to your students, copy the worksheet to your account and save. When creating an assignment, just select it as a template!
What are T-Chart Worksheets?
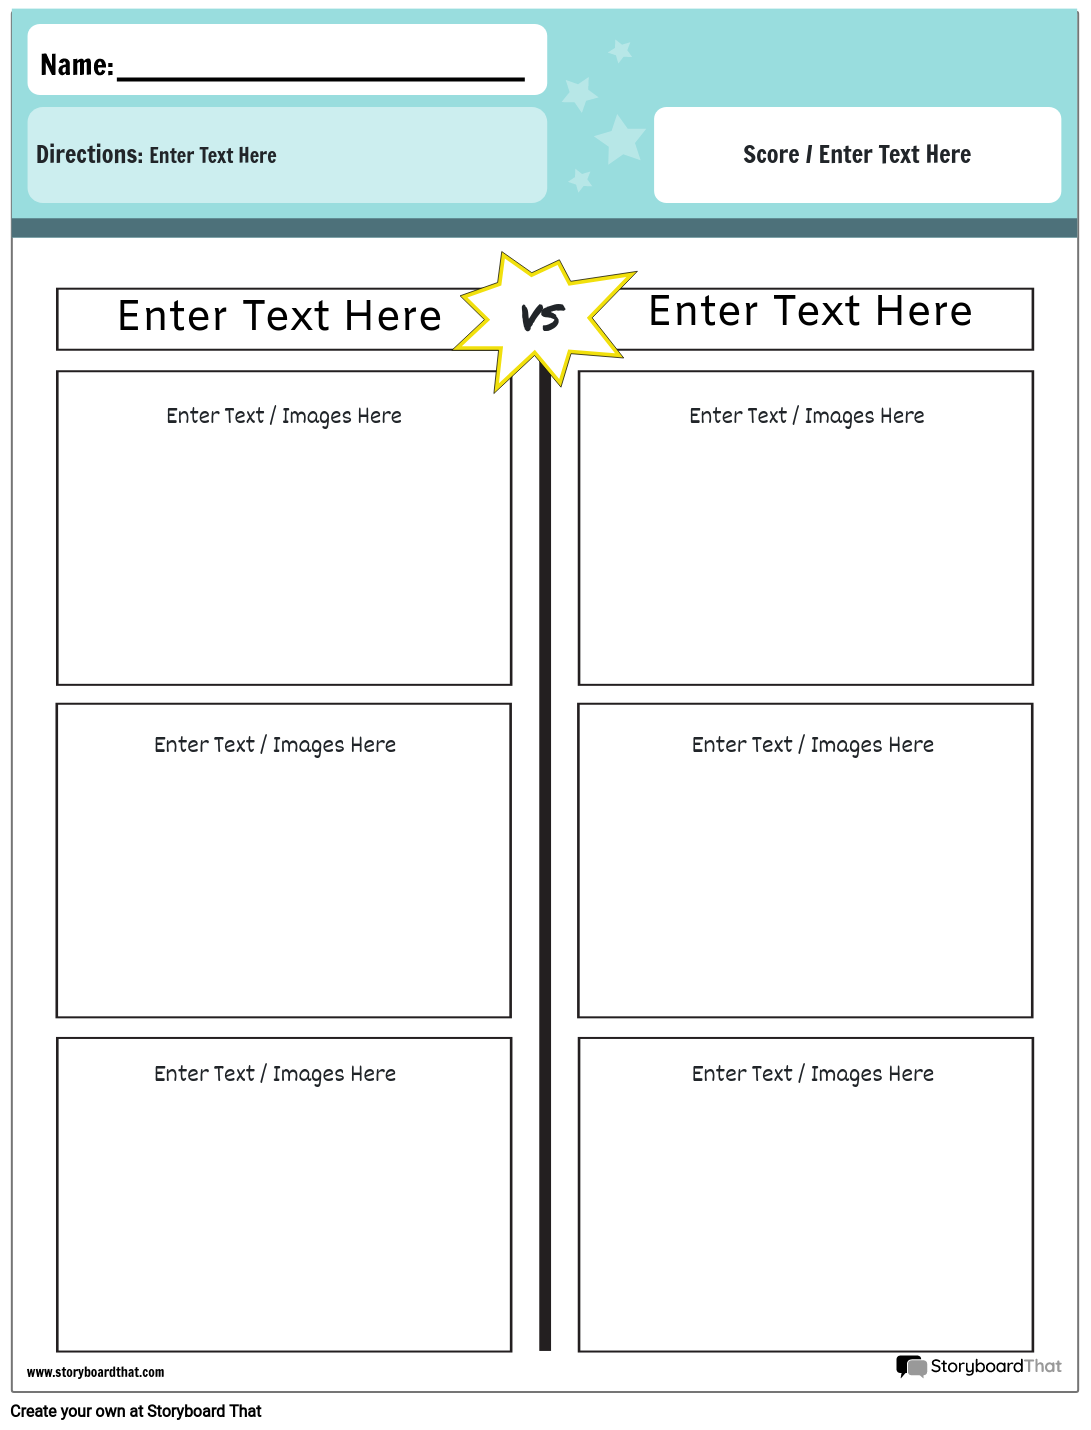
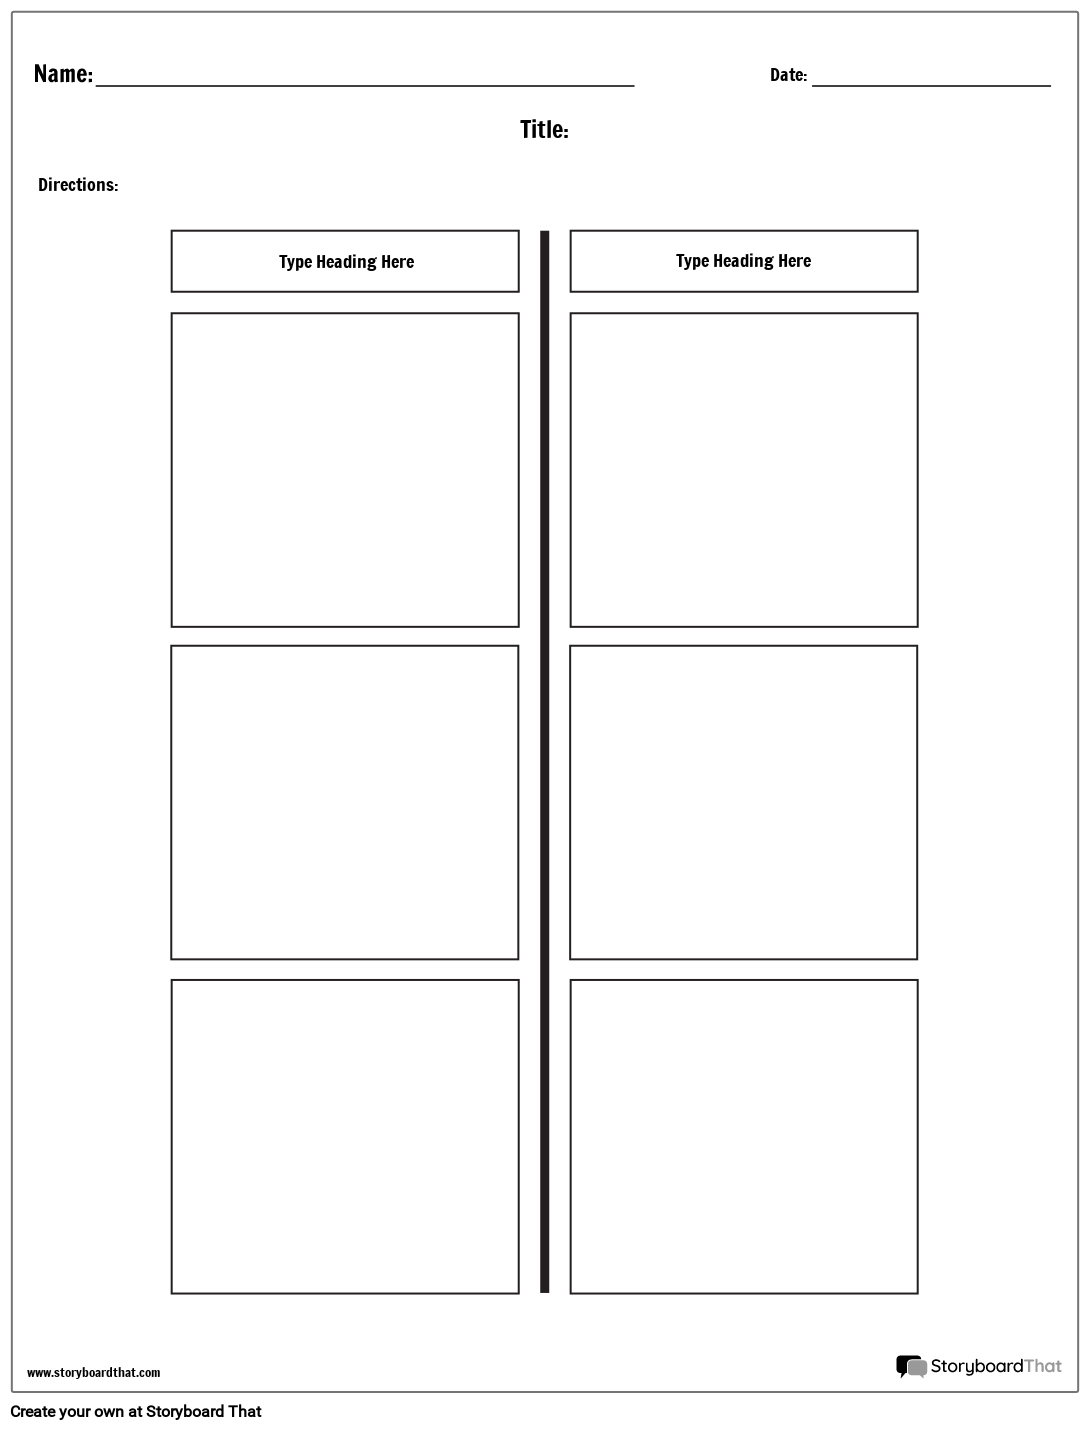
What is a T-Chart? T-Charts are so named because the main lines of the chart form the shape of a capital T. Under a heading bar, two (or more) columns are separated by a dividing line, and each column contains one of the two subjects. A T-Chart worksheet template is extremely versatile since it is very common to come across situations in everyday life where things need to be compared, pros and cons need to be weighed, and facts need to be distinguished from opinions. Whenever there is a need for comparisons, especially on the basis of different parameters, a simple T-Chart template can be useful.
Why Are They Important and How Are They Best Used?
The layout for a T-Chart template is flexible for many scenarios. The simplicity of the design makes these charts easy to create, easy to record information in, and easy to read. T-Charts can come in handy in the following ways when doing comparison tasks:
- Before and After
- Note Taking
- Cause and Effect
- Pros and Cons
- Then and Now
- Advantages and Disadvantages
- Problems and Solutions
- Facts vs Opinions
- Strengths and Weaknesses
- True or False
Ideas for Using an Editable T-Chart Template
There are several ways in which you can use a T-Chart Template in a school setting. Some T-Chart examples and ideas for activities are listed below by subject area.
Language Arts
- Compare and contrast two characters or two different books.
- List the pros and cons of a literary device, such as similes or metaphors.
- Compare and contrast two different genres of literature, such as fiction and nonfiction.
- Compare and contrast a book with its movie version.
Mathematics
- List the steps to solve a problem, with the problem on one side and the solution on the other.
- Compare and contrast different methods to solve a problem.
- Identify the similarities and differences between two different types of data displays, such as bar graphs and line graphs.
Science
- List the characteristics of living and non-living things for a project.
- Compare and contrast two different animals, plants, or ecosystems.
- List the steps of a scientific method or process, with the process on one side and the student's observations on the other side.
- Identify the different states of matter and their properties.
- Compare and contrast two different types of energy, such as kinetic and potential energy.
Social Studies
- Compare and contrast two different historical events or time periods.
- Identify the main causes and effects of a historical event.
- List the advantages and disadvantages of different forms of government.
- Compare and contrast two different cultures or civilizations.
- List the key features and examples of a geographic region or landform.
How to Make a T-Chart Worksheet
Choose One of the Blank T-Chart Templates
We have color, black and white, portrait, or landscape templates. Take a look at our T-Chart sample for inspiration!
Click on "Copy Template"
Once you do this, you will be directed to the storyboard creator.
Give Your Worksheet a Name!
Be sure to call it something related to the topic so that you can easily find it in the future.
Edit Your Worksheet
This is where you will complete directions in your own words, the date, specific questions and pictures, and make any aesthetic changes that you would like. The options are endless!
Click "Save and Exit"
When you are finished with your T-Chart worksheet, click this button in the lower right hand corner to exit your storyboard.
Next Steps
From here you can print, download as a PDF, use it in PowerPoint, attach it to an assignment and use it digitally, and more!
Even More Storyboard That Resources and Free Printables
- Circle Chart Template
- Student Organizer Worksheets
- Flow Chart Worksheets
- Anchor Chart Template
- Types of Graphic Organizers
Happy Creating!
Frequently Asked Questions About T-Charts
What is a T-Chart, and how can it be used in the classroom?
A T-Chart graphic organizer usually consists of two columns and is used to compare and contrast two topics or ideas. It is commonly used in the classroom to help students organize their thoughts and ideas. Teachers can use T-Charts to help students analyze different concepts and to write persuasive essays, research papers, or reports.
Are there any specific guidelines for creating a T-Chart?
There are no specific guidelines for creating a T-Chart. However, it is important to ensure that the chart is easy to read and understand. The T-Chart should have a clear title on the two sides, and the information should be organized in a logical manner. Teachers can use simple T-Chart templates to help students create neat and organized T-Charts.
Can T-Charts be used in all subject areas, or are they more suitable for specific subjects?
A T-Chart template can be used in all subject areas for any lesson plan. They are especially useful in subjects that require students to compare and contrast different concepts or ideas, such as ELA, social studies, science, and math.
What are some examples of how to make T-Charts useful in the classroom?
Some examples of how to use a T-Chart template in the classroom include comparing and contrasting different characters in a story, discussing opposing views, comparing and contrasting different scientific theories, and looking at different mathematical concepts.
Can T-Charts be used with younger children, or are they more suitable for older students?
T-Charts can be used with younger children. Teachers can use a simple T-Chart template with simplified language and colorful visuals to help younger children understand the concepts being compared and contrasted.
Are there any common mistakes that teachers and parents should avoid when using T-Charts in lessons?
Common mistakes when using T-Charts include not having a clear title on each side, not organizing the information in a logical manner, and not using appropriate language and terminology.
© 2025 - Clever Prototypes, LLC - All rights reserved.
StoryboardThat is a trademark of Clever Prototypes, LLC, and Registered in U.S. Patent and Trademark Office


