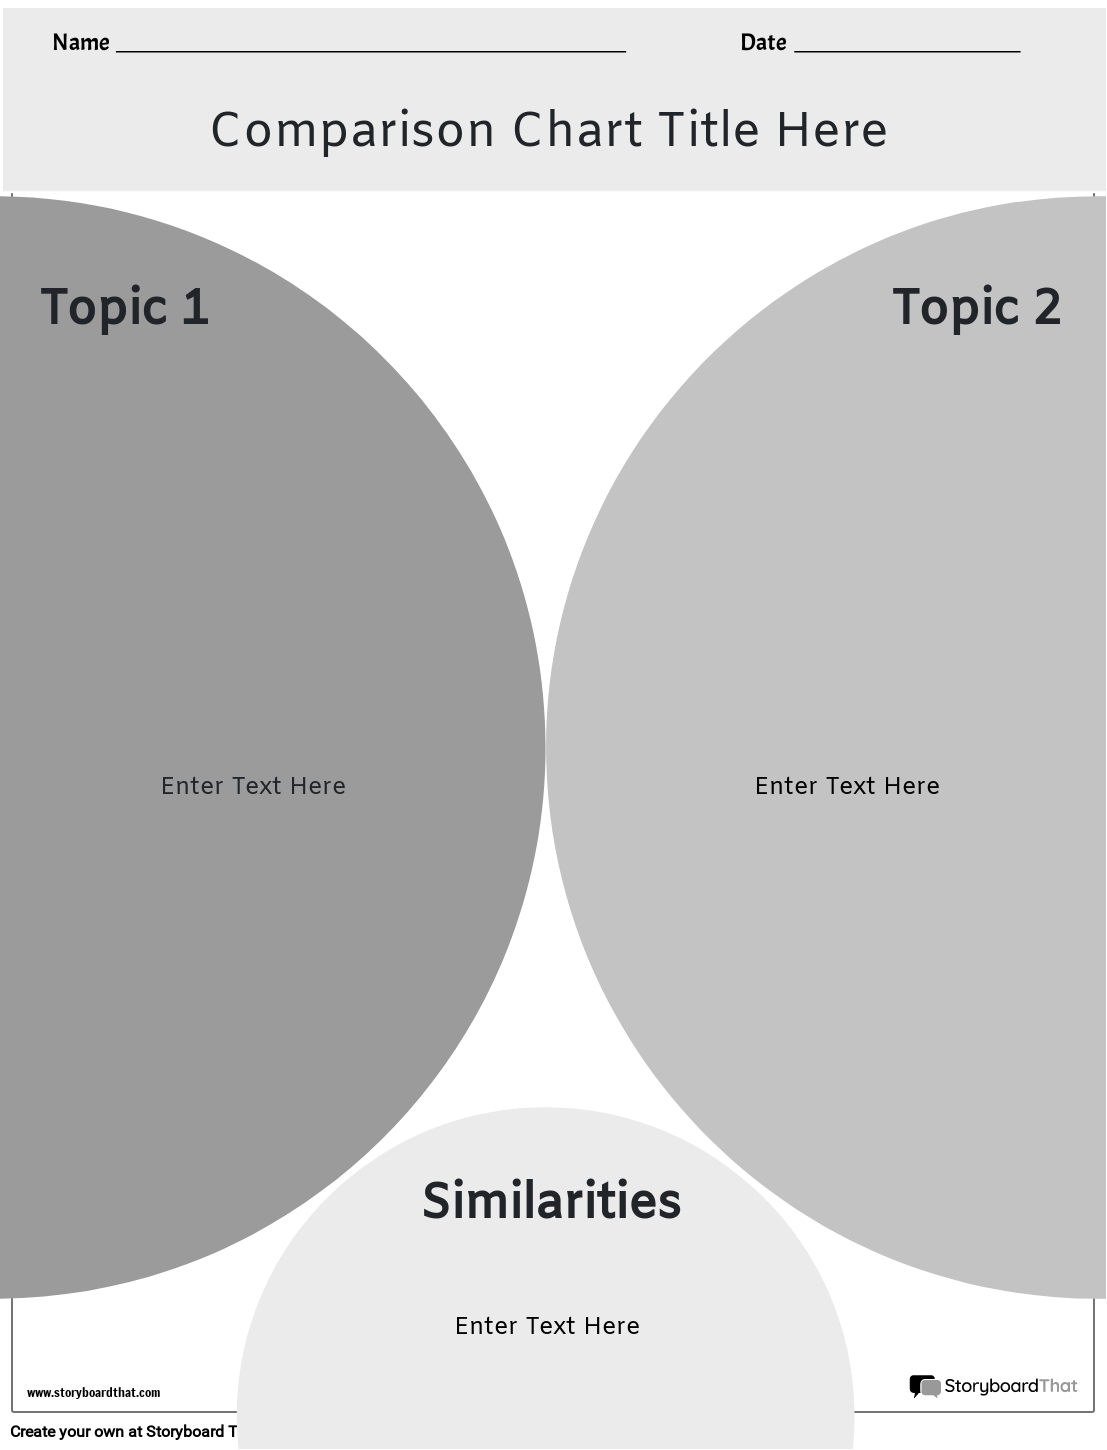
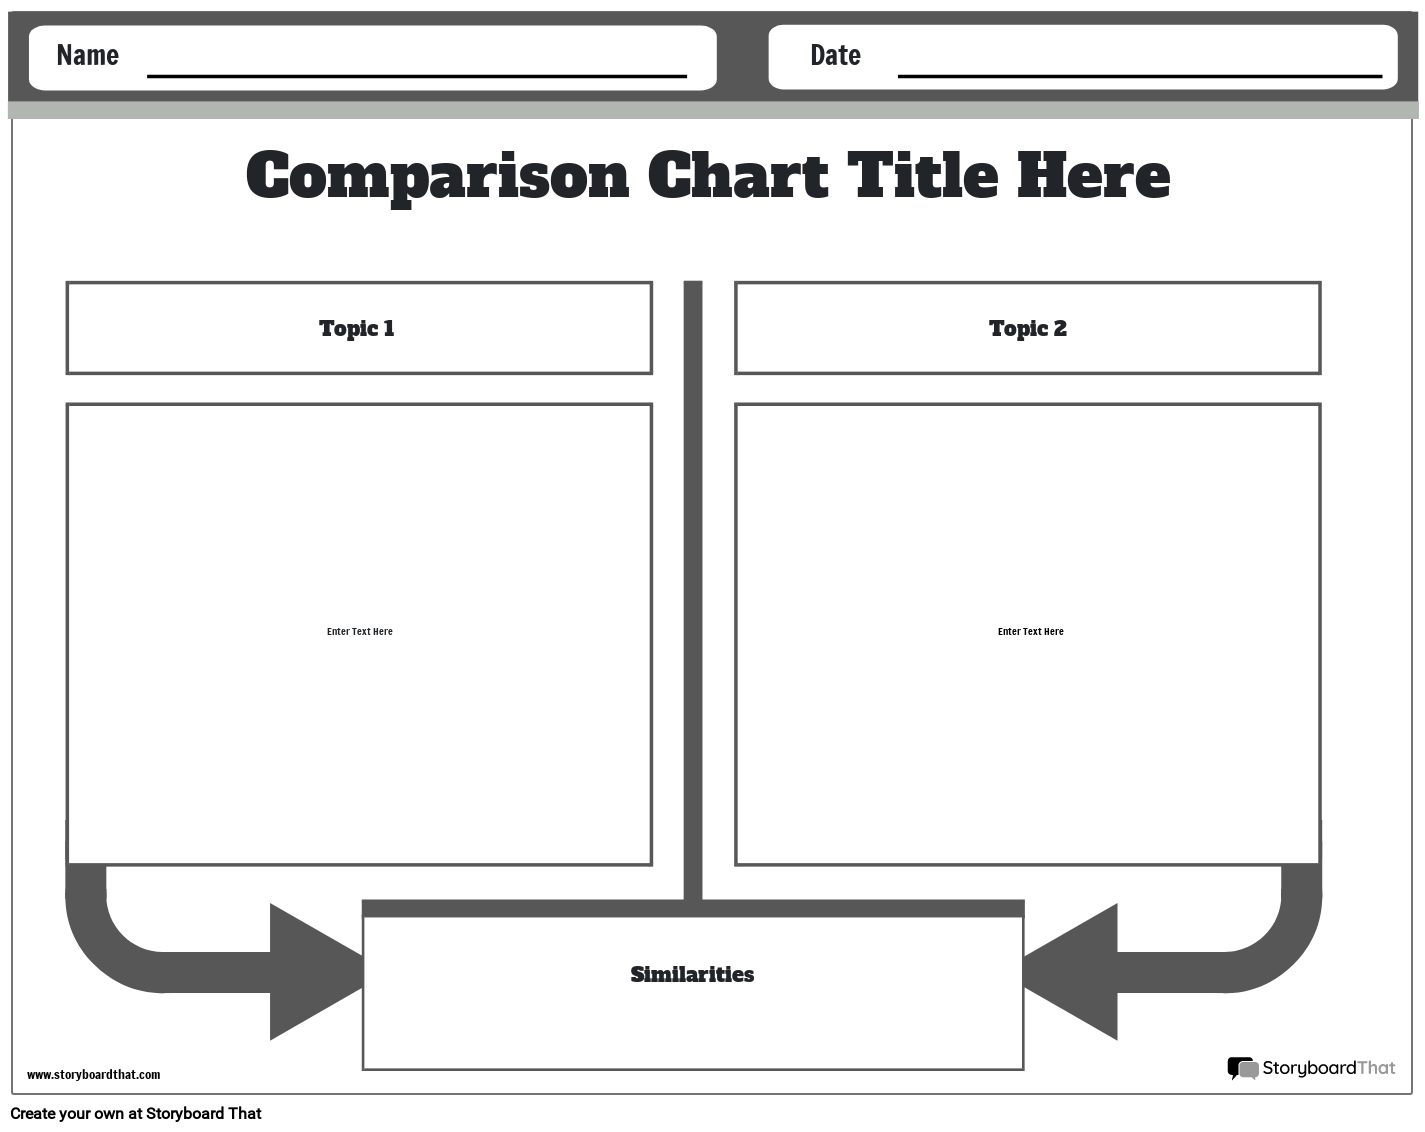
Customize Comparison Chart Templates
If you're assigning this to your students, copy the worksheet to your account and save. When creating an assignment, just select it as a template!

Using Comparison Chart Templates For Creative Projects
Comparison chart templates bring life to creative projects, offering a visually compelling and organized approach to presenting information. Whether designing, marketing, or presenting, these templates simplify comparisons, emphasize important features, and aid decision-making. Save time and explore endless possibilities, allowing creativity to take center stage.
What is a Comparison Chart and How are They Best Used?
Comparison charts are a type of data visualization that allows you to compare multiple sets of data at a glance. They help you make informed decisions by presenting information in a clear and concise way, without overwhelming you with too much data. By using comparison charts, you can easily identify trends, patterns, and differences, and make informed decisions quickly. Comparison chart templates can even offer a convenient and comprehensive visual representation, allowing you to gauge the effectiveness of your creative projects across varying screen sizes.
Use in the Classroom
Comparison charts can be a valuable instructional tool in an elementary classroom to help students organize information, make connections, and develop critical thinking skills. Here are examples of how comparison charts can be used in various subjects:
Science
- Animal Comparison: Students can create a chart to compare different animals based on their characteristics, habitat, diet, and adaptations.
- States of Matter: Students can compare the properties and behavior of solids, liquids, and gasses, including their shape, volume, and ability to change.
Social Studies
- Historical Figures: Students can compare notable historical figures, such as inventors, explorers, or leaders, by their contributions, time period, and impact on society.
- Cultures: Students can create a chart to compare different cultures, exploring elements like clothing, food, traditions, and celebrations.
Language Arts
- Characters: Students can compare characters from a story or novel, focusing on their traits, actions, and motivations.
- Settings: Students can compare different settings in stories, noting the time, place, and atmosphere created by each.
Mathematics
- Geometric Shapes: Students can compare and classify geometric shapes based on their attributes, such as the number of sides, angles, and symmetry.
- Units of Measurement: Students can create a chart to compare different units of measurement, such as length, weight, or volume, and their relationships.
Health and Wellness
- Food Comparison: Students can compare different food groups based on their nutritional value, benefits, and recommended servings.
- Physical Activities: Students can compare various physical activities in terms of their benefits, intensity level, and equipment needed.
When implementing comparison charts in the classroom, consider involving students in the process, encouraging collaboration, and providing guidance as needed. You can use visual aids, graphic organizers, or technology tools to create and display the charts. This will help students develop analytical and organizational skills while actively engaging with the subject matter.
Types of Comparison Charts
Comparison charts present information concisely, facilitating easy side-by-side comparisons of different items. They reveal similarities and differences at a glance, making them valuable tools in education as well as in business. Here are some examples of how they can be used outside of the classroom.
Feature Comparison Chart
A feature comparison chart is a popular way for companies to compare the features of their product or service with those of their competitors. By highlighting the differences between the products or services, companies can demonstrate the unique benefits of their offerings. With a comparison chart maker or comparison chart generator, creating a feature comparison chart is easy. Companies can use free comparison chart templates or create a blank comparison chart template to match their brand fonts, color scheme, and design elements. Using chart colors to distinguish between products or services can make it easier to read, and the chart can be saved in a PDF format. Creating a feature comparison chart can save time and provide viewers with a clear understanding of the benefits of a product or service.
Price Comparison Chart
Another common type of comparison chart is a price comparison chart. This type of chart is used to compare the prices of different products or services. With a price comparison chart, companies can show that their product or service is more affordable than their competitors. Companies can use multiple options when creating a price comparison chart to show the difference in prices, such as listing the prices side by side or using a visual chart to display the data. By using a comparison chart online, companies can easily update the chart as prices change.
Performance Comparison Chart
A performance comparison chart is used to compare the performance of different products or services. This type of chart is often used in the technology industry to compare the speed, capacity, or other technical specifications of products. By using a performance comparison chart, companies can demonstrate the superiority of their product or service. Using a comparison diagram can help viewers understand the technical data in an easy-to-read format.
Market Share Comparison Chart
A market share comparison chart is used to compare the market share of different companies in a particular industry or market. By using a market share comparison chart, companies can demonstrate their dominance in the market. The chart can be designed using a comparison infographic template, making it visually appealing and easy to read. A market share comparison chart can help viewers make informed decisions when choosing a product or service.
Customer Satisfaction Comparison Chart
A customer satisfaction comparison chart is used to compare the customer satisfaction levels of different companies in a particular industry or market. By using a customer satisfaction comparison chart, companies can show that they have a higher level of customer satisfaction than their competitors. The chart can be designed using one of the best comparison charts available, making it visually appealing and easy to read. Using a customer satisfaction comparison chart can help companies with decision making when it comes to improving their products or services.
Comparison charts are a perfect way to present data in a clear and concise format. They are ideal for making informed decisions, and data comparison. Companies can use various types of comparison charts, such as feature comparison charts, price comparison charts, performance comparison charts, market share comparison charts, and customer satisfaction comparison charts to make a compelling case for their products or services. With just a few clicks, companies can use chart templates to create a visually appealing and informative comparison chart that can later be saved and stored in a high-resolution PDF file format.
Create Your Own Comparison Chart Templates with Our Comparison Chart Maker
- Determine what you want to compare: Decide on what you want to compare, such as products, services, or data.
- Choose the type of comparison chart you want to create: There are different types of comparison charts, such as feature comparison charts, price comparison charts, and data comparison charts. Choose the type of chart that best fits your needs.
- Select a comparison chart template: You can either create a blank comparison chart template or choose from various comparison chart templates that are available online. You can select a template that matches your brand fonts, color scheme, and design elements.
- Use chart colors to distinguish between the items being compared: Select colors that match your brand and make it easy to read the chart.
- Add the items being compared to the chart: List the items being compared on the left-hand side of the chart.
- Add the features or data to the chart: Depending on the type of comparison chart, list the features or data that you want to compare across the top of the chart.
- Fill in the chart: Fill in the chart by placing a check mark or an "X" in the appropriate box to indicate whether the item being compared has the feature or data.
- Customize the chart: You can customize the chart by adding images, adjusting the font size, or changing the chart colors.
- Save the chart in a high-resolution PDF format: Once you have finished creating the comparison chart, save it in a high-resolution PDF file format.
- Use the chart to make informed decisions: Use the chart to compare the items and make informed decisions based on the data presented in the chart.
While making a chart from scratch is fun, don’t forget that we have tons of pre-made templates for you to choose from! Check out how to use them below!
How To Make A Comparison Chart
Choose One of the Premade Templates
We have lots of templates to choose from. Take a look at our example for inspiration!
Click on "Copy Template"
Once you do this, you will be directed to the storyboard creator.
Give Your Worksheet a Name!
Be sure to call it something related to the topic so that you can easily find it in the future.
Edit Your Worksheet
This is where you will include directions, specific questions and images, and make any aesthetic changes that you would like. The options are endless!
Click "Save and Exit"
When you are finished with your worksheet, click this button in the lower right hand corner to exit your storyboard.
Next Steps
From here you can print, download as a PDF, attach it to an assignment and use it digitally, and more!
Even More Storyboard That Resources and Free Printables
Happy Creating!
Frequently Asked Questions About Comparison Chart Worksheets
What is the purpose of using comparison chart worksheets?
Comparison chart worksheets and free templates online streamline the visual organization and comparison of data, saving time and effort. These templates provide a convenient starting point, allowing customization to meet specific needs. By utilizing them, individuals effectively analyze similarities, differences, and relationships, leading to informed decision-making and deeper understanding of complex concepts.
What are the advantages of using comparison chart worksheets?
When you create a comparison chart for your work, there are several beneficial advantages. They provide a visual representation of data or information, making it easier to grasp complex concepts or identify patterns. They also facilitate efficient comparisons, allowing for quick analysis and decision-making. Additionally, comparison chart worksheets can be used to organize and present data in a clear and structured manner, enhancing overall understanding and communication.
Are there any tips for creating effective comparison chart worksheets?
When creating comparison chart worksheets or comparison tables, it's important to consider a few key factors. First, clearly define the criteria or parameters you want to compare. Second, choose a suitable chart type (e.g., bar chart, radar chart, or Venn diagram) that best represents the data or information being compared. Thirdly, use a consistent and logical layout to ensure ease of understanding within the comparison table. Finally, consider the target audience and tailor the design and level of detail accordingly to meet their needs, ensuring that the comparison table effectively communicates the desired information.
© 2025 - Clever Prototypes, LLC - All rights reserved.
StoryboardThat is a trademark of Clever Prototypes, LLC, and Registered in U.S. Patent and Trademark Office


