Veiklos Apžvalga
Creating a science poster or infographic is a fantastic way to showcase science topics in a compelling visual format! Not only are creating science posters lots of fun for students, they also provide teachers with a worthwhile assessment at the end of a unit! Students have to think critically to determine what facts and information to highlight and how to illustrate important connections between data.
Here are some ideas for science project topics for high school:
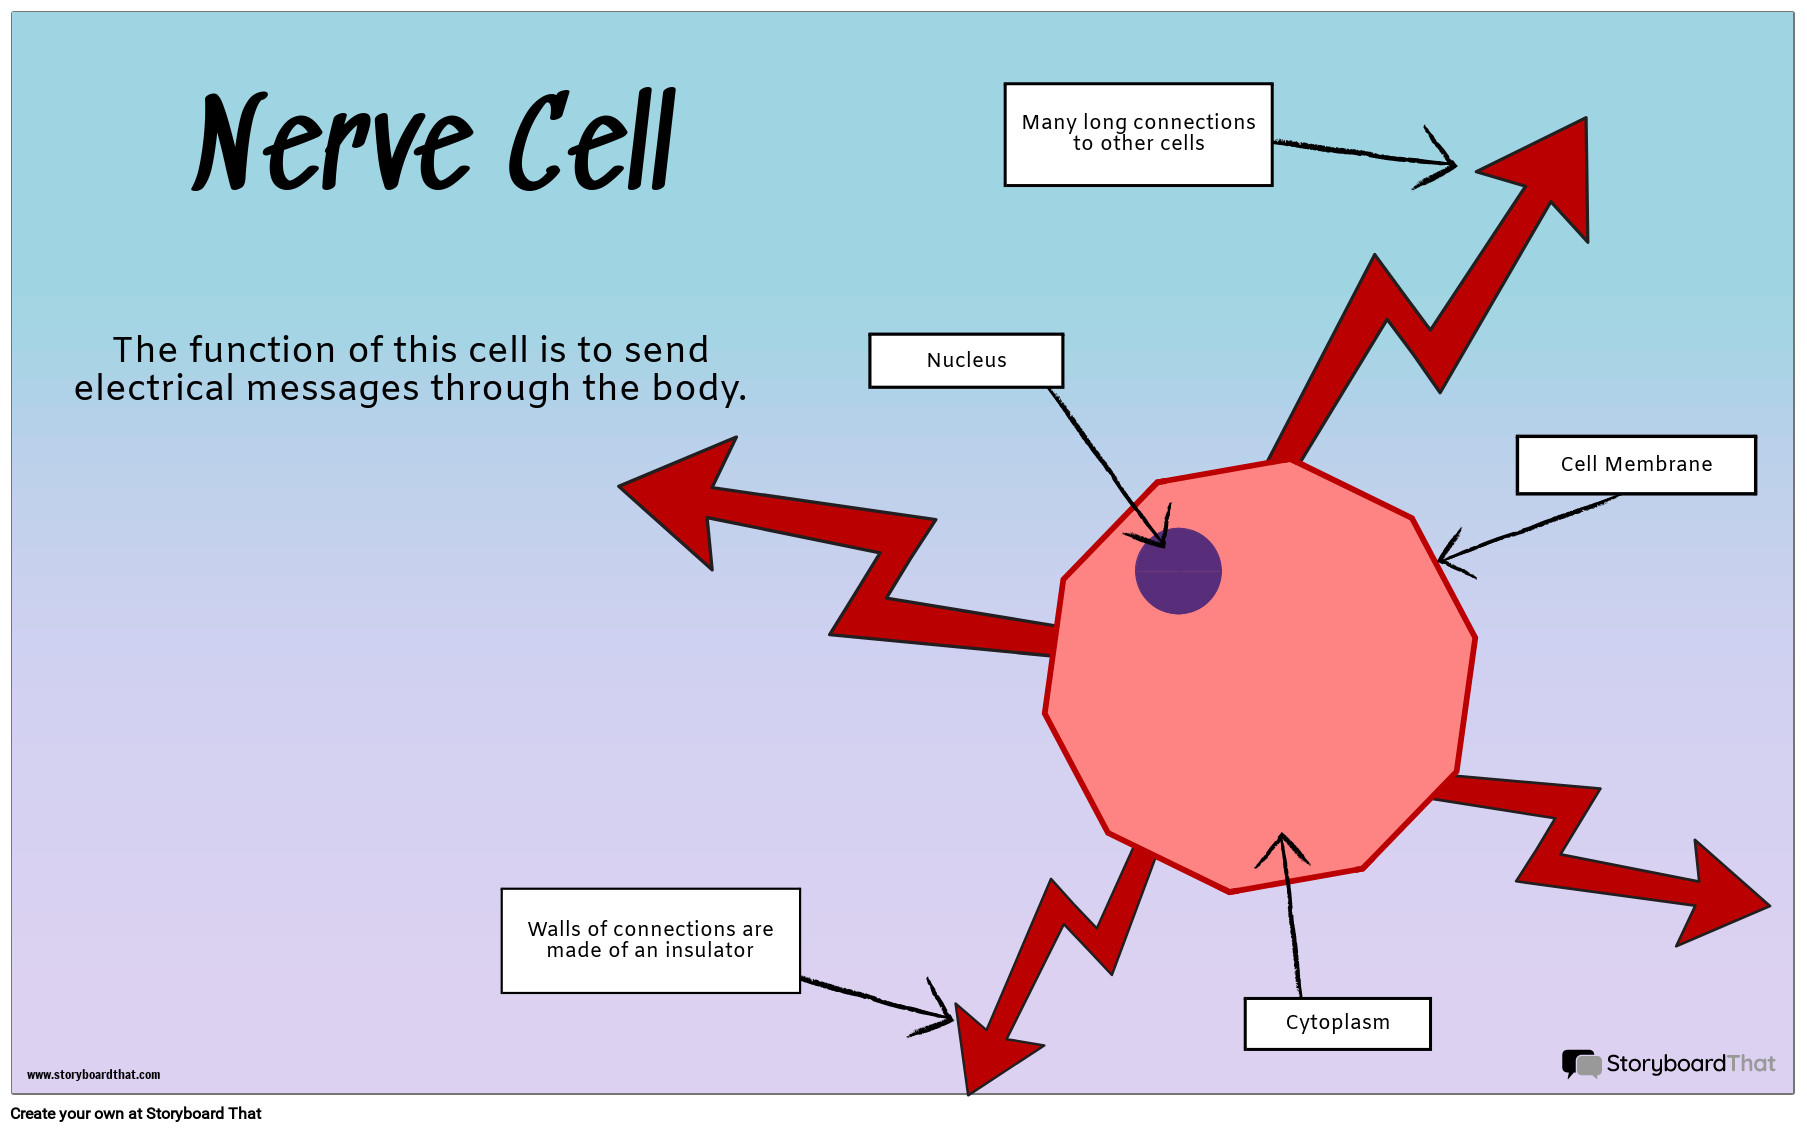
- Specialized Cells
- Basic Cells: Plant and Animal Cells
- The Carbon Cycle
- States of Matter
- The Digestive System
- Understanding Atomic Structures
- Renewable Energy
When finished, students' science posters can be printed, laminated, and hung around the classroom or school. Students can also project them onto the board and present their findings to their classmates, adding a public speaking component to the project. Teachers may wish to organize a "gallery walk" where students have the opportunity to walk around as if they are at the Science Museum!
Teachers, don't forget, you can add as many templates to your assignments as you wish! For additional templates to add to this assignment, check out our Science Infographic Templates, Science Fair Poster templates, PSA Infographic Templates or our Entire Infographic Gallery!
Šablonų ir Klasė Instrukcijos
(Šias instrukcijas galima visiškai tinkinti. Spustelėję „Kopijuoti veiklą“, atnaujinkite užduoties skirtuke Redaguoti esančias instrukcijas.)
Due Date:
Objective: Create an infographic to display your understanding of a topic
Student Instructions:
- Using your research, add important facts and details to the infographic template.
- Change fonts, colors, or styles how you wish.
- Add imagery to enhance your poster.
- Be sure to include at least 10 important facts to demonstrate what you have learned from your research.
- Save and exit when you're finished.
Pamokos Planas Nuorodos
Rubrika
(Taip pat galite sukurti savo „ Quick Rubric.)
| Puikiai | Atsiranda | Pradžia | |
|---|---|---|---|
| Vizualizacija | Siužetinė juosta aiškiai iliustruoja ląstelę, kuri tinkamai tinka nurodytai funkcijai. | Siužetinė lenta iliustruoja ląstelę, kuri tinkamai tinka nurodytai funkcijai, tačiau ją sunku suprasti. | Siužetinės ląstelės nelabai iliustruoja ląstelę, kuri tinkamai tinka nurodytai funkcijai. |
| Komponentų Identifikavimas | Ląstelių diagrama aiškiai pažymėta, rodanti, kaip ji gerai tinka jos funkcijai. | Ląstelių diagrama yra paženklinta. | Ląstelių diagrama nėra pažymėta. |
| Įrodymai Apie Pastangas | Darbas gerai parašytas ir atidžiai apgalvotas. | Darbas rodo tam tikrų pastangų įrodymų. | Darbas rodo mažai įmanomų pastangų įrodymų. |
Daugiau Storyboard That Veiklos
Aukštųjų Mokyklų Projektai


Įvadinis Mokyklos Pasiūlymas
TIK 500 USD
- 1 mokykla
- 5 mokytojai vieneriems metams
- 1 valanda virtualaus PD
30 dienų pinigų grąžinimo garantija • Tik naujiems klientams • Visa kaina po įvadinio pasiūlymo • Prieiga skirta 1 kalendoriniams metams
© 2025 - Clever Prototypes, LLC - Visos teisės saugomos.
„ StoryboardThat “ yra „ Clever Prototypes , LLC “ prekės ženklas, registruotas JAV patentų ir prekių ženklų biure.


