Lesson Plan Overview
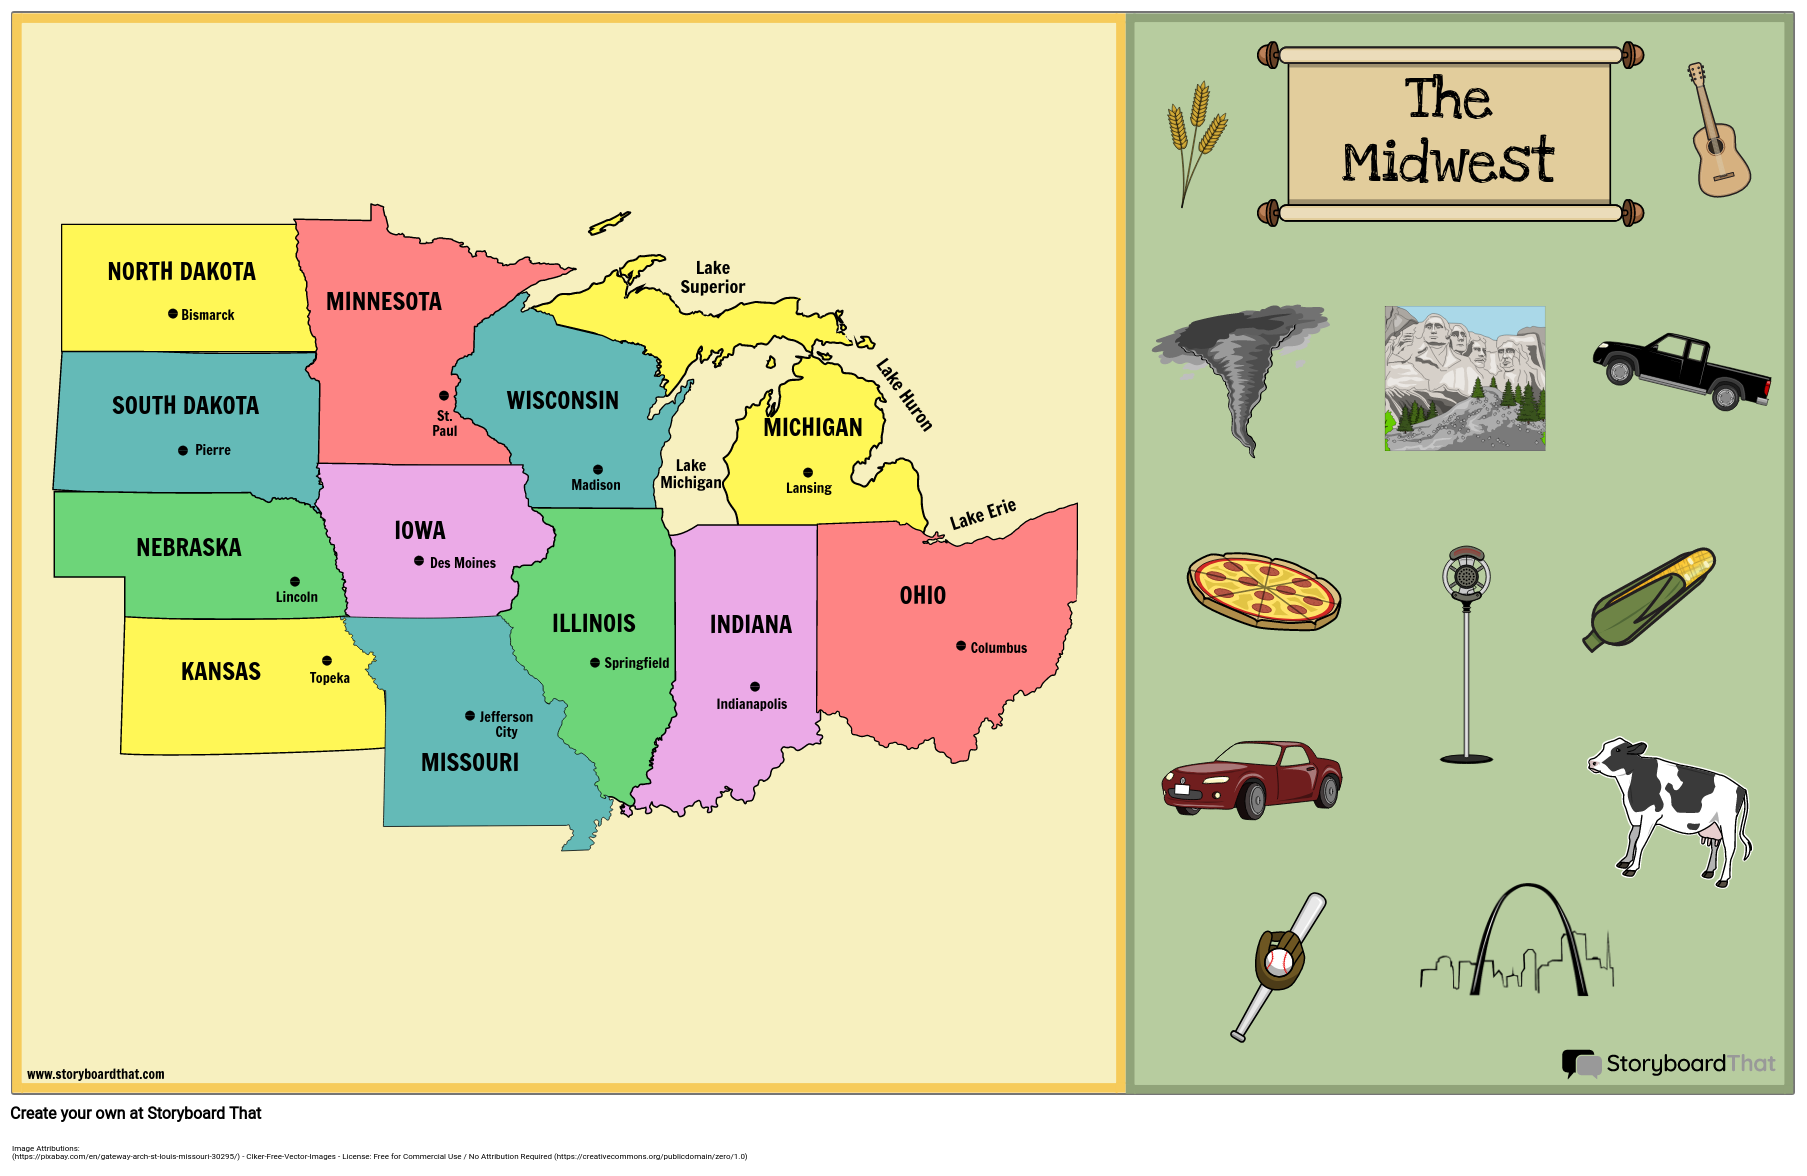
It is important for students to know the locations of the states on a map, and the capital cities of each state. Filling out a blank map or creating a map from scratch helps students retain information in a more concrete way. For this activity, students will create a poster showing the Midwestern states, capitals, and the major bodies of water. Students will also add illustrations that apply to the Midwest. Students may use a map of the United States, or use the individual states template provided to create their own map.
Template and Class Instructions
(These instructions are completely customizable. After clicking "Copy Activity", update the instructions on the Edit Tab of the assignment.)
Due Date:
Objective: Create a map of the Midwest region, including the state names, capital cities, and illustrations.
Student Instructions
- Click “Start Assignment”.
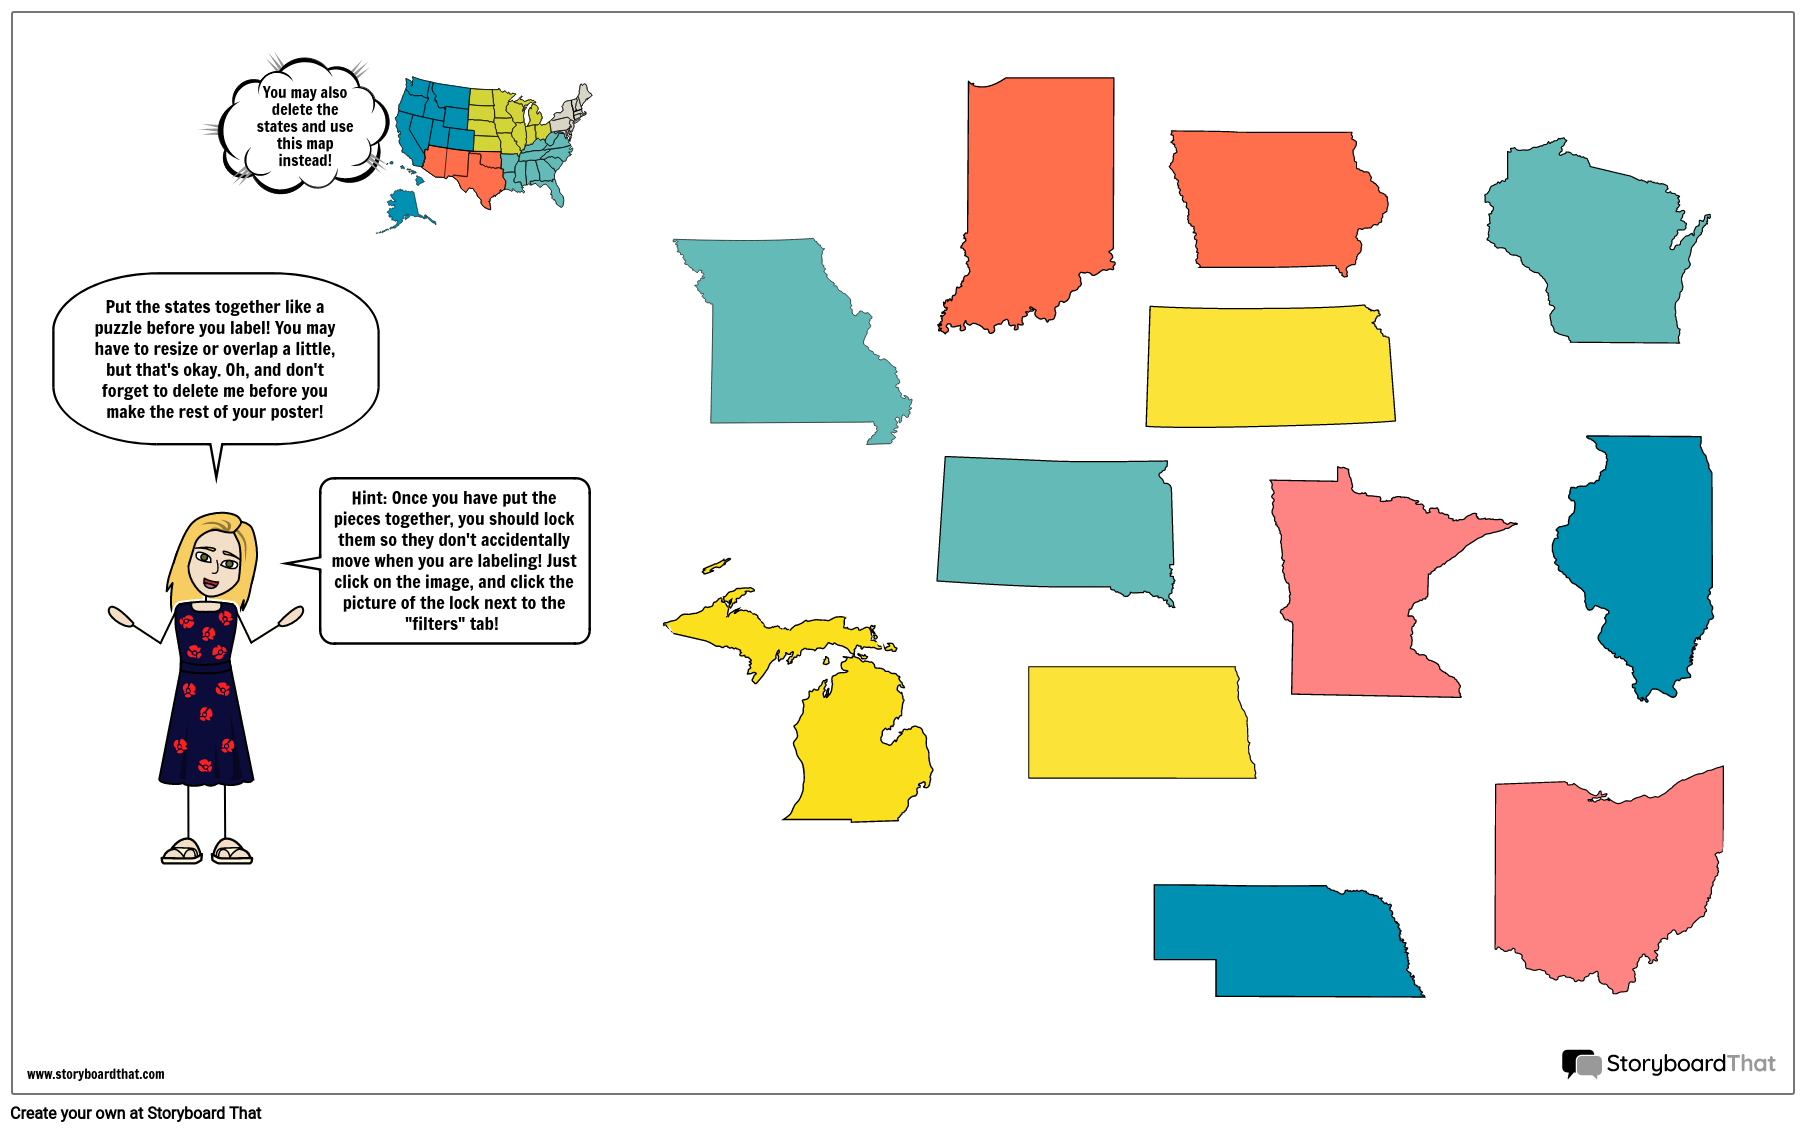
- Fill in the blank map of the Midwest, including states and capitals OR create a map of your own using the individual states provided. Use the "search" bar to find regions and states.
- Add illustrations throughout the map as desired to make it more colorful and interesting.
Lesson Plan Reference
How to Explore Urban vs. Rural Geography in the Midwest
Introduction to Urban vs. Rural Geography in the Midwest
Begin the lesson by introducing students to the key concepts of urban and rural geography. Discuss the differences between urban and rural areas, including population density, land use, and infrastructure. Provide examples of urban and rural regions within the Midwest.
Research and Data Collection
Divide the class into small groups and assign each group a specific area within the Midwest, either urban or rural. Instruct students to research their assigned area and gather data on key characteristics, such as population, types of industries, land use, and transportation infrastructure. Provide access to maps, online resources, and geographic data to assist in their research.
Creation of Urban and Rural Maps
Guide students in creating separate maps to represent the urban and rural areas they researched. Instruct them to include visual elements that depict the characteristics of each area, such as population density, land use, transportation networks, and major landmarks. Encourage the use of symbols, colors, and labels to make the maps informative and visually appealing.
Analysis and Discussion
Have each group present their urban and rural maps to the class. Engage students in discussions about the differences and similarities between urban and rural geography in the Midwest. Encourage critical thinking and analysis of how geographic factors influence the characteristics of these regions.
Frequently Asked Questions about Midwest Region Map
What are the major geographic features and natural landmarks of the Midwest, and how can I find them on a map?
The major geographic features and natural landmarks of the Midwest include the Great Lakes, the Mississippi River, the Ozark Mountains, the Badlands, and the Great Plains. To find them on a map, use a geographic map of the Midwest. You can identify the Great Lakes' locations along the northern border, the winding path of the Mississippi River, the Ozark Mountains in Missouri and Arkansas, the Badlands in South Dakota, and the vast plains that cover much of the region. Topographic maps are also helpful for understanding elevation and terrain features.
What types of maps and resources can be incorporated into storyboards and worksheets to help students plan a cross-country road trip through the Midwest, considering major highways, attractions, and rest areas?
To help students plan a cross-country road trip through the Midwest, consider incorporating the following maps and resources into storyboards and worksheets: Road Maps: Use detailed road maps, which are readily available online or in print, to highlight major highways, routes, and interstates, along with rest areas and service centers. These maps can help students plan their routes. Tourist Maps: Include tourist maps of key cities and attractions in the Midwest. These maps often feature points of interest, accommodations, and places to visit, aiding students in creating a travel itinerary. Online Interactive Maps: Utilize online interactive maps and resources, such as Google Maps or specialized road trip planning tools. These platforms offer real-time data on traffic, attractions, and rest stops. Travel Guides: Encourage students to use travel guides or websites that provide insights into recommended routes, attractions, and tips for road trips through the Midwest.
What types of maps and data can be included in storyboards and worksheets to help students analyze demographic and cultural trends in the Midwest, such as population distribution, diversity, and cultural characteristics?
To help students analyze demographic and cultural trends in the Midwest, consider incorporating the following types of maps and data into storyboards and worksheets: Demographic Maps: Utilize demographic maps that display population distribution, density, and growth trends in the Midwest. These maps often use color-coding to represent different demographic factors. Cultural Maps: Incorporate maps that highlight cultural characteristics, such as ethnic communities, language distribution, and cultural festivals in the region. Historical Maps: Include historical maps that illustrate the changing demographics and cultural shifts in the Midwest over time. These maps can show the historical development of cities and settlements. Infographics: Create infographics that visually present demographic and cultural data in a clear and engaging manner. Infographics can include pie charts, bar graphs, and other visual representations. Interactive Online Tools: Encourage students to explore interactive online tools and resources that provide demographic and cultural data for the Midwest, allowing for in-depth analysis. These maps and data sources will enable students to understand and analyze the diverse demographic and cultural characteristics of the Midwest region effectively.
More Storyboard That Activities
US Regions: Midwest
Testimonials

“By using the product, they were so excited and they learned so much...”–K-5 Librarian and Instructinal Technology Teacher

“I'm doing a Napoleon timeline and I'm having [students] determine whether or not Napoleon was a good guy or a bad guy or somewhere in between.”–History and Special Ed Teacher

“Students get to be creative with Storyboard That and there's so many visuals for them to pick from... It makes it really accessible for all students in the class.”–Third Grade Teacher
© 2025 - Clever Prototypes, LLC - All rights reserved.
StoryboardThat is a trademark of Clever Prototypes, LLC, and Registered in U.S. Patent and Trademark Office


