How To Make a Tally Chart

يمكنك أن تجد هذه القصة المصورة في المواد والموارد التالية:

تعليم المخططات البيانية تالي مع القصص المصورة
خطط الدرس من آنا وارفيلد
كمعلمين ، نحتاج إلى إعداد عقول صغيرة لعقود مستقبلية مهمة تعتمد على البيانات. مخطط الإحصاء سهل الاستخدام والفهم ، لذا فهو اختيار ممتاز للباحثين لأول مرة. تعرف على المزيد مع Storyboard That!

رسم تخطيطي لعملية
خطط الدرس من آنا وارفيلد
يمكن فهم التعليمات والعمليات بسهولة أكبر عندما تكون مصحوبة بصور. عندما نرسم عملية ما أو ننشئ رسمًا بيانيًا تسلسليًا ، يمكننا التركيز على الخطوات المنفصلة والسبب والنتيجة والتسلسل.
'
القصة المصورة الوصف
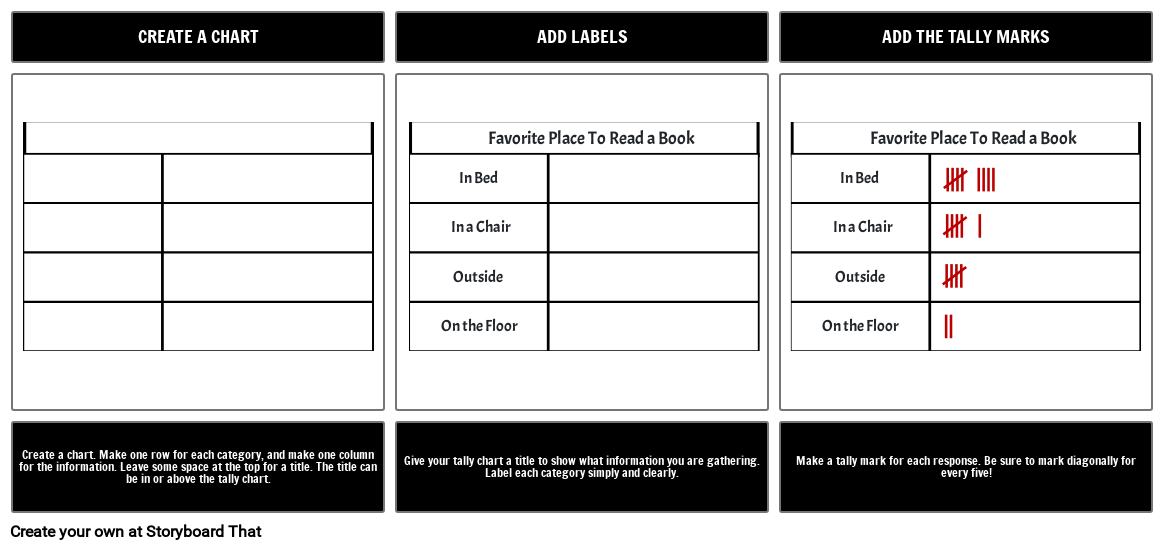
Making a tally chart is easy. Make a box, add some labels, and tally ho!
نص القصة المصورة
- CREATE A CHART
- Outside Outside
- In Bed In Bed
- On the Floor On the Floor
- In a Chair In a Chair
- Favorite Place To Read a Book Favorite Place To Read a Book
- ADD LABELS
- ADD THE TALLY MARKS
- Create a chart. Make one row for each category, and make one column for the information. Leave some space at the top for a title. The title can be in or above the tally chart.
- Give your tally chart a title to show what information you are gathering. Label each category simply and clearly.
- Make a tally mark for each response. Be sure to mark diagonally for every five!
تم إنشاء أكثر من 30 مليون من القصص المصورة
لا توجد تنزيلات ولا بطاقة ائتمان ولا حاجة إلى تسجيل الدخول للمحاولة!

