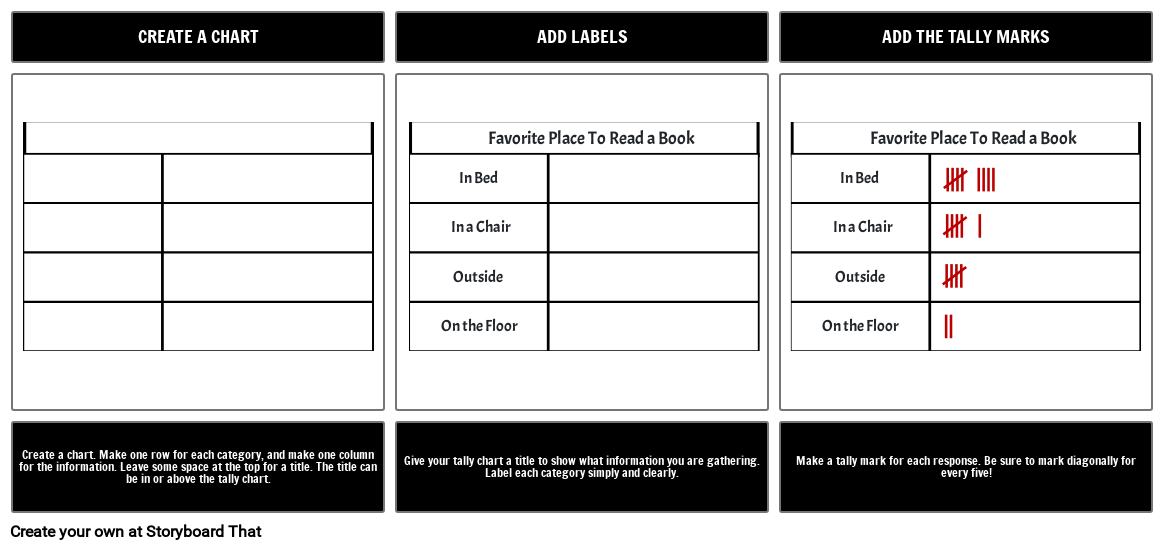
How To Make a Tally Chart

You can find this storyboard in the following articles and resources:

Teaching Tally Charts with Storyboards
Lesson Plans by Anna Warfield
As educators, we need to prepare little minds for important data-driven futures. The tally chart is easy to use and understand, so it is an excellent choice for first-time researchers. Learn more with Storyboard That!

Diagram a Process
Lesson Plans by Anna Warfield
Instructions and processes are so much more easily understood when accompanied by visuals. When we storyboard a process or create a sequential diagram, we can focus on discrete steps, cause and effect, and sequence.
'
Storyboard Description
Making a tally chart is easy. Make a box, add some labels, and tally ho!
Storyboard Text
- CREATE A CHART
- Outside Outside
- In Bed In Bed
- On the Floor On the Floor
- In a Chair In a Chair
- Favorite Place To Read a Book Favorite Place To Read a Book
- ADD LABELS
- ADD THE TALLY MARKS
- Create a chart. Make one row for each category, and make one column for the information. Leave some space at the top for a title. The title can be in or above the tally chart.
- Give your tally chart a title to show what information you are gathering. Label each category simply and clearly.
- Make a tally mark for each response. Be sure to mark diagonally for every five!
Over 30 Million Storyboards Created
No Downloads, No Credit Card, and No Login Needed to Try!


