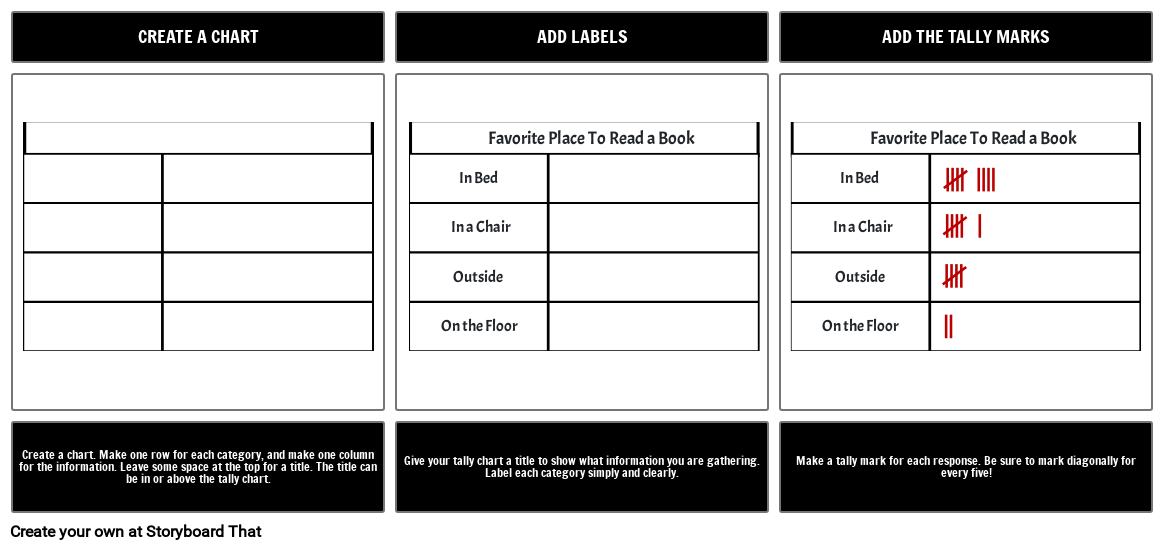
How To Make a Tally Chart

Você pode encontrar este storyboard nos seguintes artigos e recursos:

Ensinando Gráficos de Tally com Storyboards
Planos de Aula de Anna Warfield
Como educadores, precisamos preparar mentes pequenas para futuros importantes baseados em dados. O gráfico de contagem é fácil de usar e entender, por isso é uma excelente opção para pesquisadores iniciantes. Saiba mais com Storyboard That!

Diagrama de um Processo
Planos de Aula de Anna Warfield
Instruções e processos são muito mais fáceis de entender quando acompanhados de recursos visuais. Quando fazemos o storyboard de um processo ou criamos um diagrama sequencial, podemos nos concentrar em etapas discretas, causa e efeito e sequência.
'
Storyboard Descrição
Making a tally chart is easy. Make a box, add some labels, and tally ho!
Texto do Storyboard
- CREATE A CHART
- Outside Outside
- In Bed In Bed
- On the Floor On the Floor
- In a Chair In a Chair
- Favorite Place To Read a Book Favorite Place To Read a Book
- ADD LABELS
- ADD THE TALLY MARKS
- Create a chart. Make one row for each category, and make one column for the information. Leave some space at the top for a title. The title can be in or above the tally chart.
- Give your tally chart a title to show what information you are gathering. Label each category simply and clearly.
- Make a tally mark for each response. Be sure to mark diagonally for every five!
Mais de 30 milhões de storyboards criados
Sem Downloads, sem Cartão de Crédito e sem Necessidade de Login Para Experimentar!


