Storyboard-1

Texto do Storyboard
- Deslizar: 1
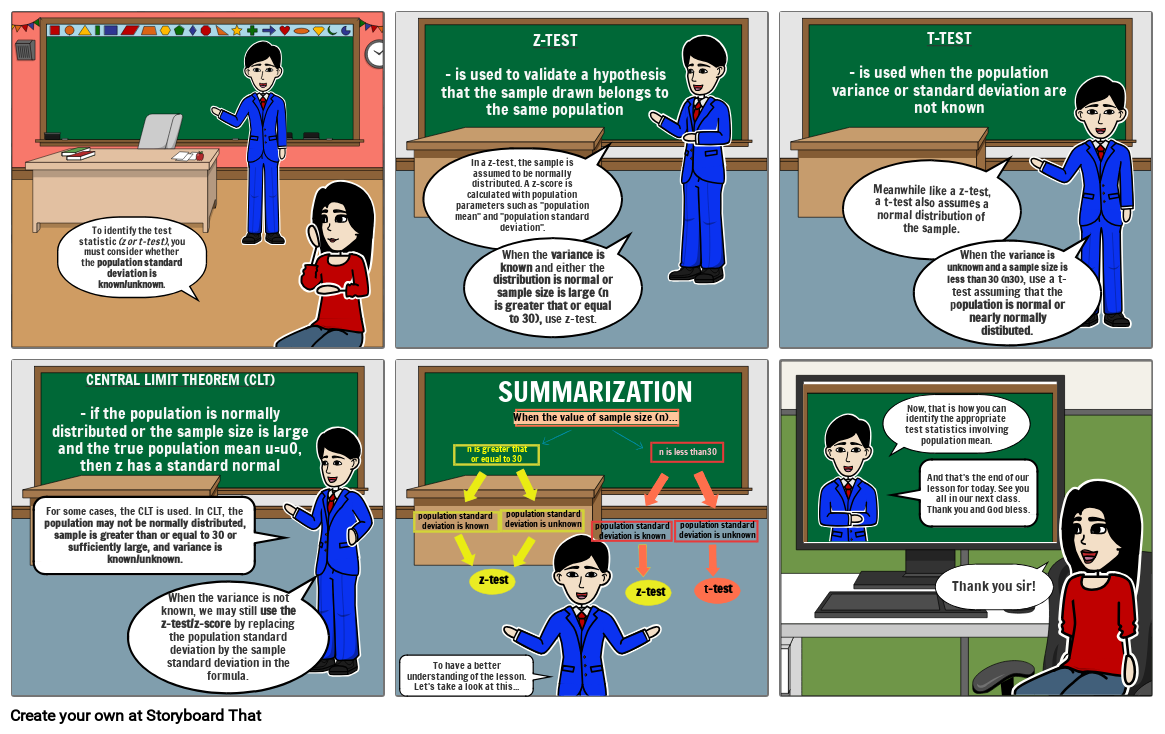
- To identify the test statistic (z or t-test), you must consider whether the population standard deviation is known/unknown.
- Deslizar: 2
- Z-TEST- is used to validate a hypothesis that the sample drawn belongs to the same population
- In a z-test, the sample is assumed to be normally distributed. A z-score is calculated with population parameters such as "population mean" and "population standard deviation".
- When the variance is known and either the distribution is normal or sample size is large (n is greater that or equal to 30), use z-test.
- SUMMARIZATION
- Deslizar: 3
- T-TEST- is used when the population variance or standard deviation are not known
- Meanwhile like a z-test, a t-test also assumes a normal distribution of the sample.
- When the variance is unknown and a sample size is less than 30 (n30), use a t-test assuming that the population is normal or nearly normally distibuted.
- Deslizar: 4
- CENTRAL LIMIT THEOREM (CLT)- if the population is normally distributed or the sample size is large and the true population mean u=u0, then z has a standard normal distribution.
- For some cases, the CLT is used. In CLT, the population may not be normally distributed, sample is greater than or equal to 30 or sufficiently large, and variance is known/unknown.
- When the variance is not known, we may still use the z-test/z-score by replacing the population standard deviation by the sample standard deviation in the formula.
- Deslizar: 5
- When the value of sample size (n)...
- n is less than30
- n is greater that or equal to 30
-
-
-
-
- population standard deviation is unknown
- population standard deviation is known
- population standard deviation is unknown
- population standard deviation is known
-
-
-
-
-
-
- z-test
-
- t-test
- z-test
- To have a better understanding of the lesson. Let's take a look at this...
- Deslizar: 6
- Now, that is how you can identify the appropriate test statistics involving population mean.
- And that's the end of our lesson for today. See you all in our next class. Thank you and God bless.
- Thank you sir!
Mais de 30 milhões de storyboards criados

