How To Make a Tally Chart

Jūs varat atrast šo montāžas šādās rakstiem un resursi:

Mācību Tally diagrammas ar storyboards
Annas Vorfīldas Stundu Plāni
Kā pedagogiem mums ir jāsagatavo mazie prāti svarīgai, uz datiem balstītai nākotnei. Tabulu diagramma ir viegli lietojama un saprotama, tāpēc tā ir lieliska izvēle pirmo reizi pētniekiem. Uzziniet vairāk, izmantojot Storyboard That!

Diagrammu Process
Annas Vorfīldas Stundu Plāni
Instrukcijas un procesi ir daudz vieglāk saprotami, ja tos papildina vizuālie materiāli. Kad mēs veidojam procesa sižetu vai veidojam secīgu diagrammu, mēs varam koncentrēties uz diskrētiem soļiem, cēloni un sekām un secību.
'
Montāžas Apraksts
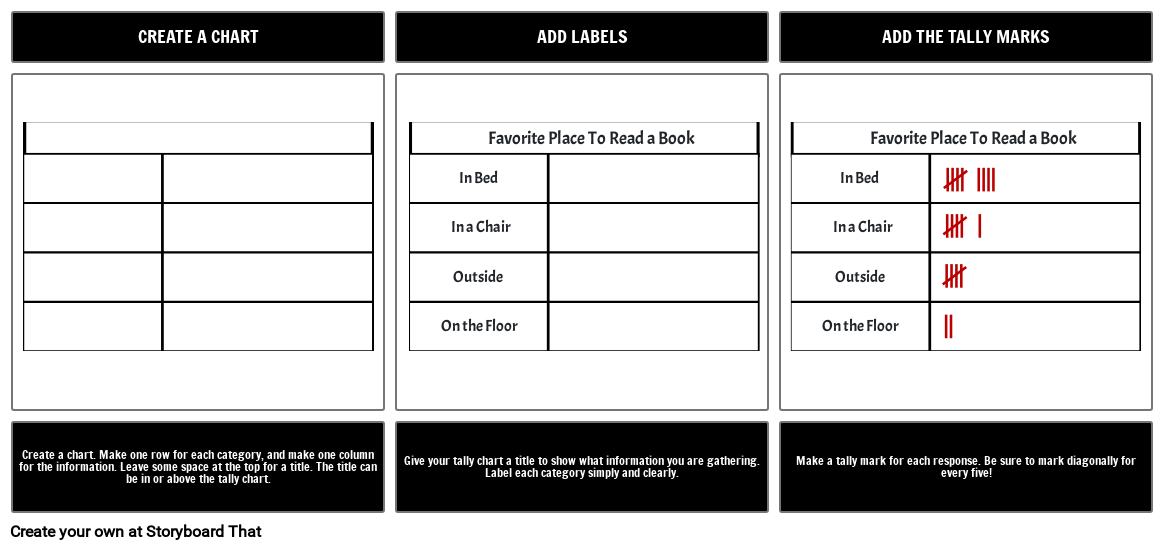
Making a tally chart is easy. Make a box, add some labels, and tally ho!
Montāžas Teksta
- CREATE A CHART
- Outside Outside
- In Bed In Bed
- On the Floor On the Floor
- In a Chair In a Chair
- Favorite Place To Read a Book Favorite Place To Read a Book
- ADD LABELS
- ADD THE TALLY MARKS
- Create a chart. Make one row for each category, and make one column for the information. Leave some space at the top for a title. The title can be in or above the tally chart.
- Give your tally chart a title to show what information you are gathering. Label each category simply and clearly.
- Make a tally mark for each response. Be sure to mark diagonally for every five!
Izveidoti vairāk nekā 30 miljoni stāstu shēmu
Lai Izmēģinātu, nav Nepieciešama Lejupielāde, nav Kredītkartes un nav Nepieciešama Pieteikšanās!

