Jayden servin

Storyboard Descrizione
central tendency
Testo Storyboard
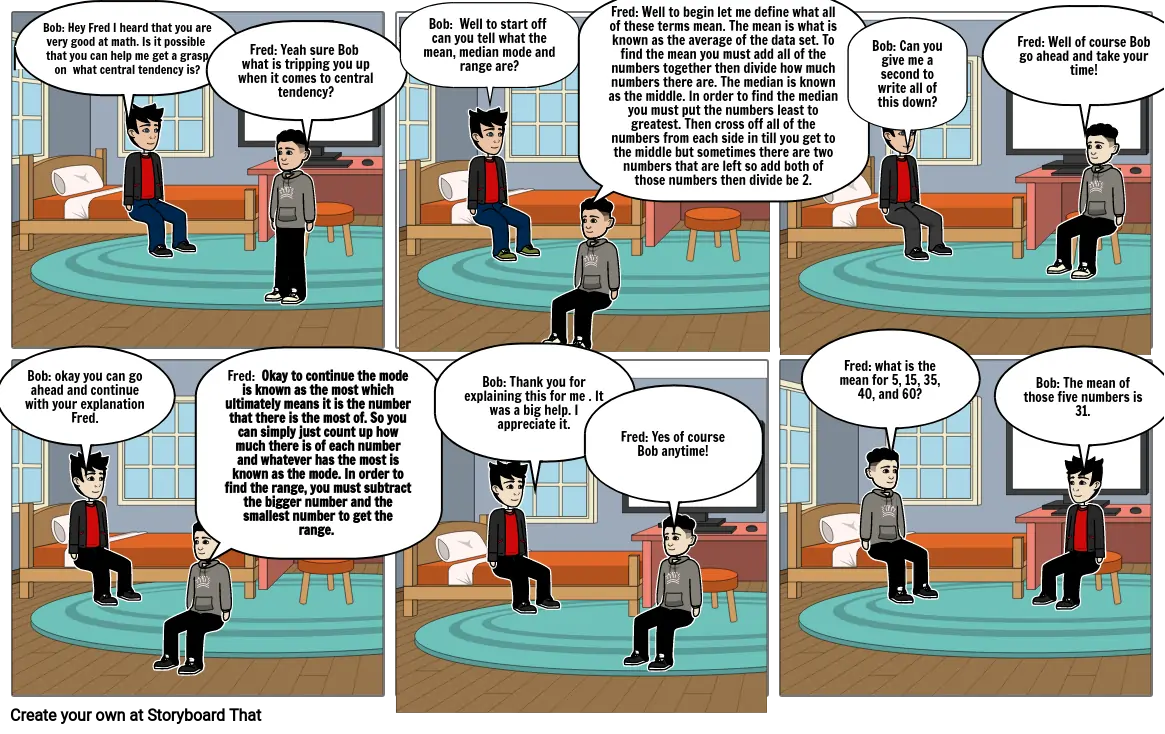
- Bob: okay you can go ahead and continue with your explanation Fred.
- Bob: Hey Fred I heard that you are very good at math. Is it possible that you can help me get a grasp on what central tendency is?
- Fred: Okay to continue the mode is known as the most which ultimately means it is the number that there is the most of. So you can simply just count up how much there is of each number and whatever has the most is known as the mode. In order to find the range, you must subtract the bigger number and the smallest number to get the range.
- Fred: Yeah sure Bob what is tripping you up when it comes to central tendency?
- Bob: Well to start off can you tell what the mean, median mode and range are?
- Bob: Thank you for explaining this for me . It was a big help. I appreciate it.
- Fred: Well to begin let me define what all of these terms mean. The mean is what is known as the average of the data set. To find the mean you must add all of the numbers together then divide how much numbers there are. The median is known as the middle. In order to find the median you must put the numbers least to greatest. Then cross off all of the numbers from each side in till you get to the middle but sometimes there are two numbers that are left so add both of those numbers then divide be 2.
- Fred: what is the mean for 5, 15, 35, 40, and 60?
- Bob: Can you give me a second to write all of this down?
- Fred: Well of course Bob go ahead and take your time!
- Bob: The mean of those five numbers is 31.
- Fred: Yes of course Bob anytime!
Oltre 30 milioni di storyboard creati

