communicateing statistics relations (1)

स्टोरीबोर्ड पाठ
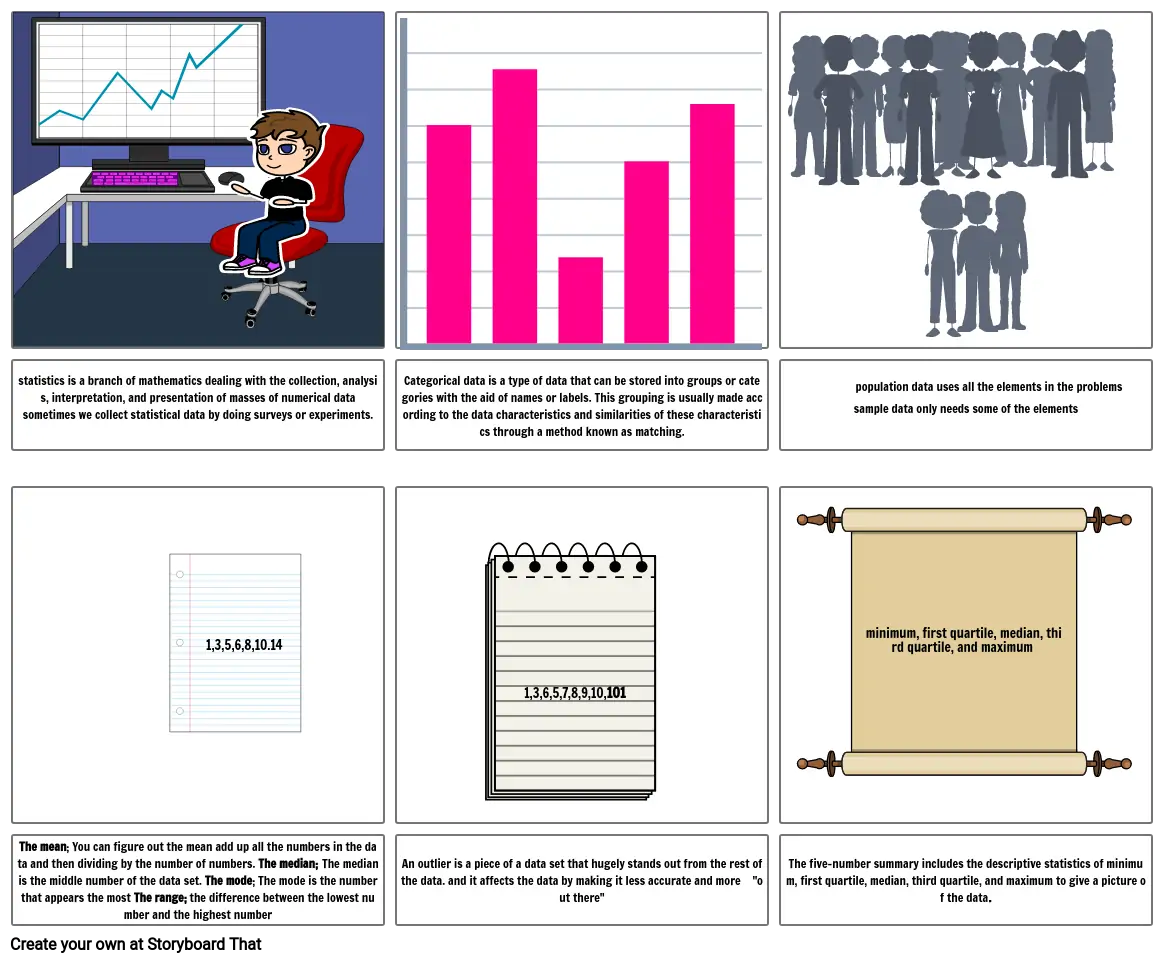
- statistics is a branch of mathematics dealing with the collection, analysis, interpretation, and presentation of masses of numerical datasometimes we collect statistical data by doing surveys or experiments.
- 1,3,5,6,8,10.14
- Categorical data is a type of data that can be stored into groups or categories with the aid of names or labels. This grouping is usually made according to the data characteristics and similarities of these characteristics through a method known as matching.
- 1,3,6,5,7,8,9,10,101
- population data uses all the elements in the problems sample data only needs some of the elements
- minimum, first quartile, median, third quartile, and maximum
- The mean; You can figure out the mean add up all the numbers in the data and then dividing by the number of numbers. The median; The median is the middle number of the data set. The mode; The mode is the number that appears the most The range; the difference between the lowest number and the highest number
- An outlier is a piece of a data set that hugely stands out from the rest of the data. and it affects the data by making it less accurate and more "out there"
- The five-number summary includes the descriptive statistics of minimum, first quartile, median, third quartile, and maximum to give a picture of the data.
30 मिलियन से अधिक स्टोरीबोर्ड बनाए गए

