Spreadsheets by Rashi

Texte du Storyboard
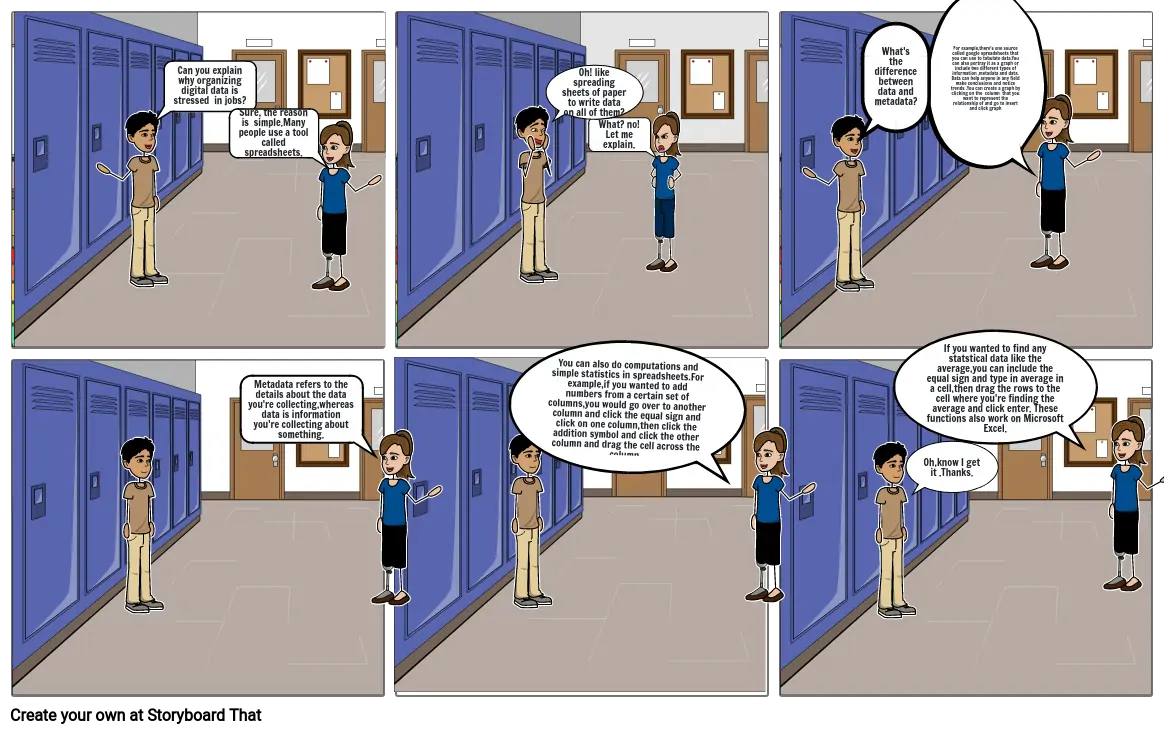
- Can you explain why organizing digital data is stressed in jobs?
- Sure, the reason is simple.Many people use a tool called spreadsheets.
- You can also do computations and simple statistics in spreadsheets.For example,if you wanted to add numbers from a certain set of columns,you would go over to another column and click the equal sign and click on one column,then click the addition symbol and click the other column and drag the cell across the column.
- Oh! like spreading sheets of paper to write data on all of them?
- What? no! Let me explain.
- What's the difference between data and metadata?
- If you wanted to find any statstical data like the average,you can include the equal sign and type in average in a cell,then drag the rows to the cell where you're finding the average and click enter. These functions also work on Microsoft Excel.
- For example,there's one source called google spreadsheets that you can use to tabulate data.You can also portray it as a graph or include two different types of information ,metadata and data. Data can help anyone in any field make conclusions and notice trends .You can create a graph by clicking on the column that you want to represent the relationship of and go to insert and click graph
- Metadata refers to the details about the data you're collecting,whereas data is information you're collecting about something.
- Oh,know I get it .Thanks.
Plus de 30 millions de storyboards créés

