lesson

Texte du Storyboard
- Glisser: 1
- Screen 1
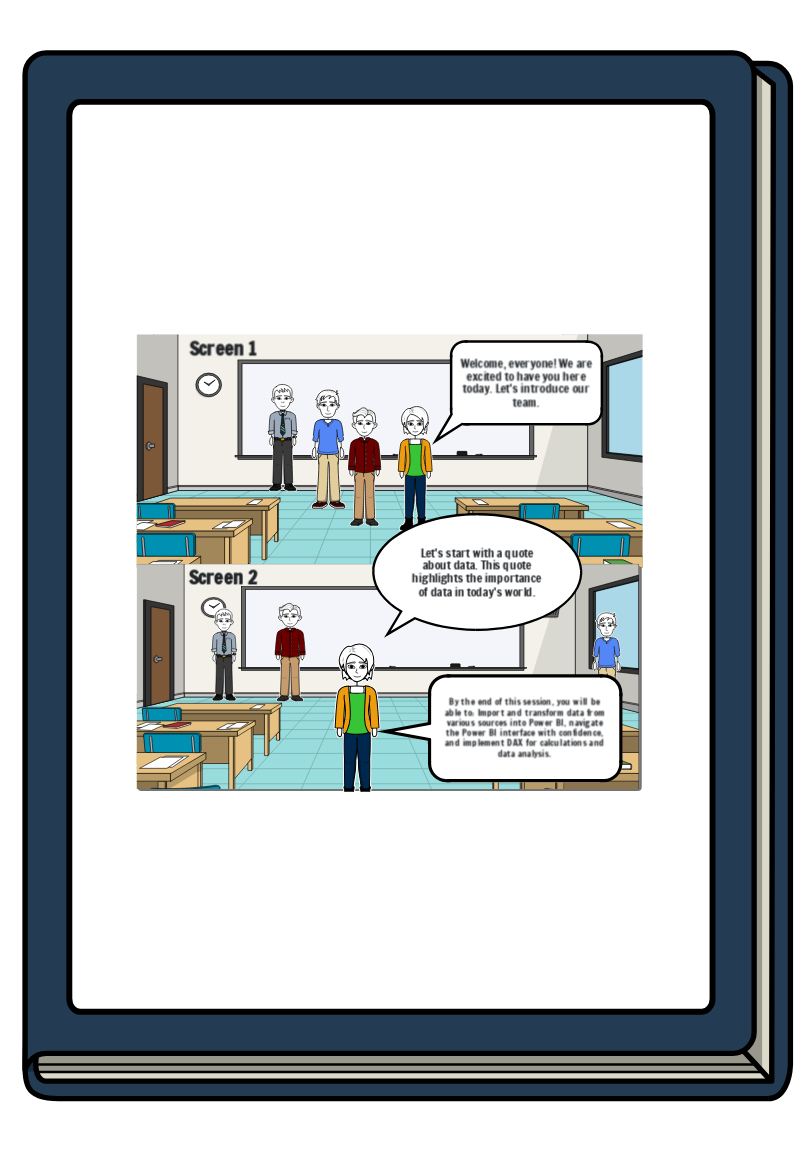
- Welcome, everyone! We are excited to have you here today. Let's introduce our team.
- Let's start with a quote about data. This quote highlights the importance of data in today's world.
- Screen 2
- By the end of this session, you will be able to: Import and transform data from various sources into Power BI, navigate the Power BI interface with confidence, and implement DAX for calculations and data analysis.
- Glisser: 2
- Screen 3
- As you know, we conducted a pre-assessment survey to understand your current knowledge of Power BI. Thank you for your responses, which have helped us tailor this session to your needs.
- Screen 4
- We'll start by demonstrating how to link Power BI to several data sources. Let's begin with Excel, then move on to SQL Server, and finally, online data sources.
- Glisser: 3
- Screen 5
- Next, we'll use the Power Query Editor to clean, transform, and combine data. Follow along as we demonstrate these processes with a sample dataset.
- Screen 6
- Now, we'll provide a tour of the Power BI interface, highlighting significant features and tools. We'll create a small report live to demonstrate the process.
- Glisser: 4
- Screen 7
- Finally, we'll cover the basics of DAX. We'll show you how to build measures and calculated columns using standard DAX functions such as SUM, AVERAGE, and IF.
- Glisser: 5
- Screen 8
- Let's wrap up with some questions to test your understanding of Power BI. Please share any feedback you have about today's session.
- Glisser: 6
- Screen 10
- To summarize, we've covered how to import and transform data, navigate the Power BI interface, and use DAX for calculations. If you have any doubts, feel free to ask now.
- For your next steps, we recommend exploring more advanced features of Power BI and practicing with different datasets. Here's a road map for your future learning and progress.
Attributions D'image
- https://pixabay.com/en/pi-symbol-letter-mathematics-math-1327145/ - FotoshopTofs - (Licence Free for Commercial Use / No Attribution Required (https://creativecommons.org/publicdomain/zero/1.0) )
- 3699331 - manfredsteger - (Licence Free for Most Commercial ? No Attribution Required ? See https://pixabay.com/service/license/ for full license )
Plus de 30 millions de storyboards créés
Aucun Téléchargement, Aucune Carte de Crédit et Aucune Connexion Nécessaire Pour Essayer !
