How To Make a Tally Chart

Vous pouvez trouver ce storyboard dans les articles et ressources suivants:

Enseigner les tableaux de pointage avec des storyboards
Plans de Cours par Anna Warfield
En tant qu'éducateurs, nous devons préparer les petits esprits à d'importants futurs axés sur les données. Le tableau de pointage est facile à utiliser et à comprendre, c'est donc un excellent choix pour les chercheurs débutants. En savoir plus avec Storyboard That!

Diagramme D'un Processus
Plans de Cours par Anna Warfield
Les instructions et les processus sont tellement plus faciles à comprendre lorsqu'ils sont accompagnés de visuels. Lorsque nous scénarisons un processus ou créons un diagramme séquentiel, nous pouvons nous concentrer sur des étapes discrètes, la cause et l'effet et la séquence.
'
Storyboard Description
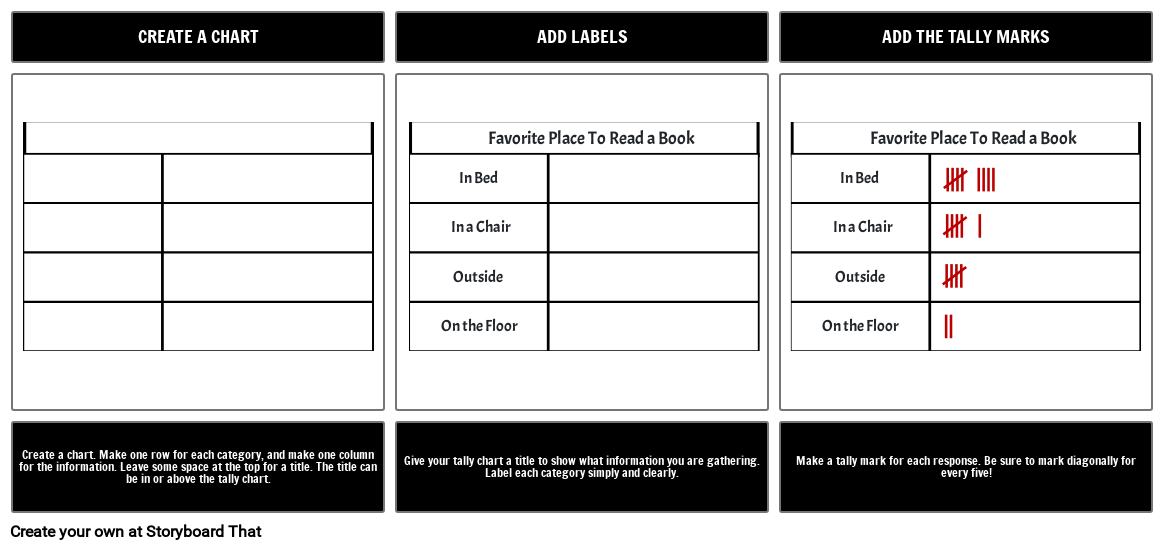
Making a tally chart is easy. Make a box, add some labels, and tally ho!
Texte du Storyboard
- CREATE A CHART
- Outside Outside
- In Bed In Bed
- On the Floor On the Floor
- In a Chair In a Chair
- Favorite Place To Read a Book Favorite Place To Read a Book
- ADD LABELS
- ADD THE TALLY MARKS
- Create a chart. Make one row for each category, and make one column for the information. Leave some space at the top for a title. The title can be in or above the tally chart.
- Give your tally chart a title to show what information you are gathering. Label each category simply and clearly.
- Make a tally mark for each response. Be sure to mark diagonally for every five!
Plus de 30 millions de storyboards créés
Aucun Téléchargement, Aucune Carte de Crédit et Aucune Connexion Nécessaire Pour Essayer !

