Statistics Project

Texte du Storyboard
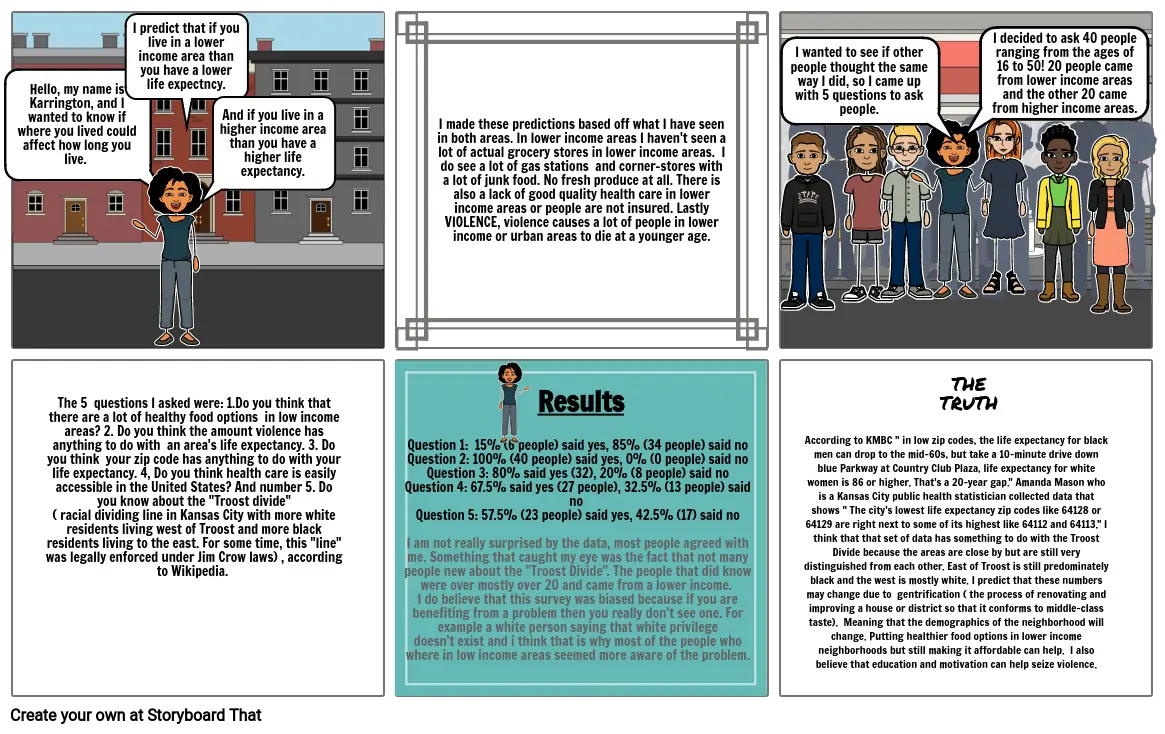
- Hello, my name is Karrington, and I wanted to know if where you lived could affect how long you live.
- The 5 questions I asked were: 1.Do you think that there are a lot of healthy food options in low income areas? 2. Do you think the amount violence has anything to do with an area's life expectancy. 3. Do you think your zip code has anything to do with your life expectancy. 4, Do you think health care is easily accessible in the United States? And number 5. Do you know about the "Troost divide" ( racial dividing line in Kansas City with more white residents living west of Troost and more black residents living to the east. For some time, this "line" was legally enforced under Jim Crow laws) , according to Wikipedia.
- I predict that if you live in a lower income area than you have a lower life expectncy.
- And if you live in a higher income area than you have a higher life expectancy.
- I made these predictions based off what I have seen in both areas. In lower income areas I haven't seen a lot of actual grocery stores in lower income areas. I do see a lot of gas stations and corner-stores with a lot of junk food. No fresh produce at all. There is also a lack of good quality health care in lower income areas or people are not insured. Lastly VIOLENCE, violence causes a lot of people in lower income or urban areas to die at a younger age.
- I wanted to see if other people thought the same way I did, so I came up with 5 questions to ask people.
- THE TRUTH
- I decided to ask 40 people ranging from the ages of 16 to 50! 20 people came from lower income areas and the other 20 came from higher income areas.
- Question 1: 15% (6 people) said yes, 85% (34 people) said noQuestion 2: 100% (40 people) said yes, 0% (0 people) said noQuestion 3: 80% said yes (32), 20% (8 people) said noQuestion 4: 67.5% said yes (27 people), 32.5% (13 people) said no Question 5: 57.5% (23 people) said yes, 42.5% (17) said noI am not really surprised by the data, most people agreed with me. Something that caught my eye was the fact that not many people new about the "Troost Divide". The people that did know were over mostly over 20 and came from a lower income. I do believe that this survey was biased because if you are benefiting from a problem then you really don't see one. For example a white person saying that white privilege doesn't exist and i think that is why most of the people who where in low income areas seemed more aware of the problem.
- Results
- According to KMBC " in low zip codes, the life expectancy for black men can drop to the mid-60s, but take a 10-minute drive down blue Parkway at Country Club Plaza, life expectancy for white women is 86 or higher. That's a 20-year gap." Amanda Mason who is a Kansas City public health statistician collected data that shows " The city’s lowest life expectancy zip codes like 64128 or 64129 are right next to some of its highest like 64112 and 64113." I think that that set of data has something to do with the Troost Divide because the areas are close by but are still very distinguished from each other. East of Troost is still predominately black and the west is mostly white. I predict that these numbers may change due to gentrification ( the process of renovating and improving a house or district so that it conforms to middle-class taste). Meaning that the demographics of the neighborhood will change. Putting healthier food options in lower income neighborhoods but still making it affordable can help. I also believe that education and motivation can help seize violence.
- uhyh
Plus de 30 millions de storyboards créés

