How To Make a Tally Chart
CREATE A CHART
ADD LABELS
ADD THE TALLY MARKS
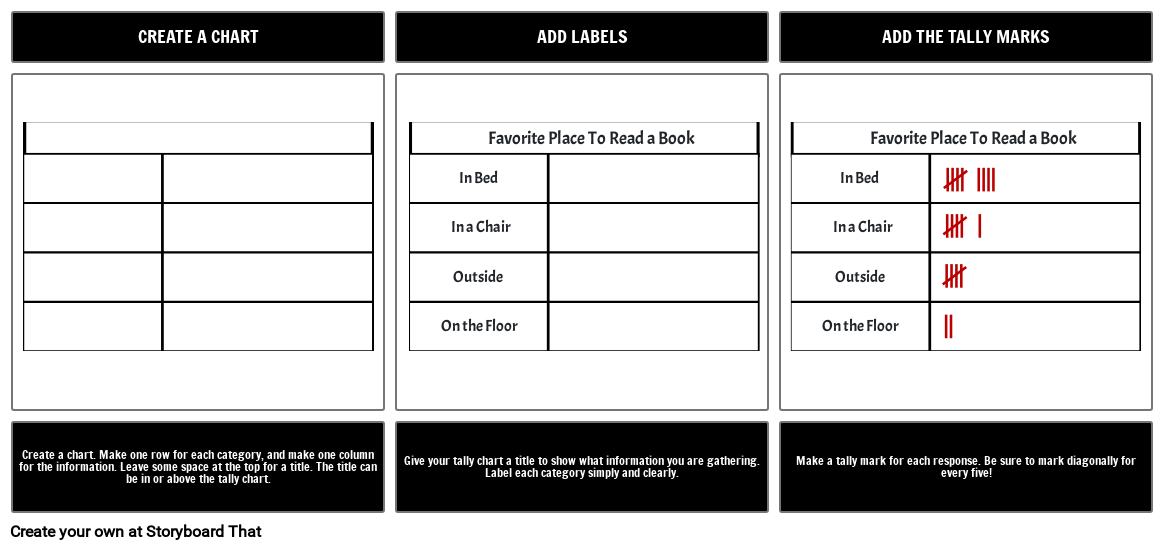
Create a chart. Make one row for each category, and make one column for the information. Leave some space at the top for a title. The title can be in or above the tally chart.
Give your tally chart a title to show what information you are gathering. Label each category simply and clearly.
Make a tally mark for each response. Be sure to mark diagonally for every five!
Favorite Place To Read a Book
In Bed
In a Chair
Outside
On the Floor
Favorite Place To Read a Book
In Bed
In a Chair
Outside
On the Floor

Löydät kuvakäsikirjoituksen seuraavissa artikkeleissa ja resurssit:

Opetus Tally kaavioita Storyboards
Anna Warfieldin Oppituntisuunnitelmat
Kouluttajina meidän on valmistettava pienet mielet tärkeitä datalähtöisiä tulevaisuuksia varten. Taulukkokaavio on helppokäyttöinen ja helppo ymmärtää, joten se on erinomainen valinta ensikertalaisille tutkijoille. Lue lisää Storyboard That!

Kaavio Process
Anna Warfieldin Oppituntisuunnitelmat
Ohjeet ja prosessit ovat niin paljon helpommin ymmärrettävissä, kun niihin liittyy visuaalisuutta. Kun piirrämme prosessia tai luomme peräkkäisen kaavion, voimme keskittyä erillisiin vaiheisiin, syihin ja seurauksiin sekä sekvenssiin.
'
Kuvakäsikirjoitus Kuvaus
Making a tally chart is easy. Make a box, add some labels, and tally ho!
Kuvakäsikirjoitus Teksti
- CREATE A CHART
- Outside Outside
- In Bed In Bed
- On the Floor On the Floor
- In a Chair In a Chair
- Favorite Place To Read a Book Favorite Place To Read a Book
- ADD LABELS
- ADD THE TALLY MARKS
- Create a chart. Make one row for each category, and make one column for the information. Leave some space at the top for a title. The title can be in or above the tally chart.
- Give your tally chart a title to show what information you are gathering. Label each category simply and clearly.
- Make a tally mark for each response. Be sure to mark diagonally for every five!
Yli 30 miljoonaa kuvakäsikirjoitusta luotu
Ei Latauksia, ei Luottokorttia ja ei Vaadi Kirjautumista Kokeilemiseen!


