Geography Project 1

Texto del Guión Gráfico
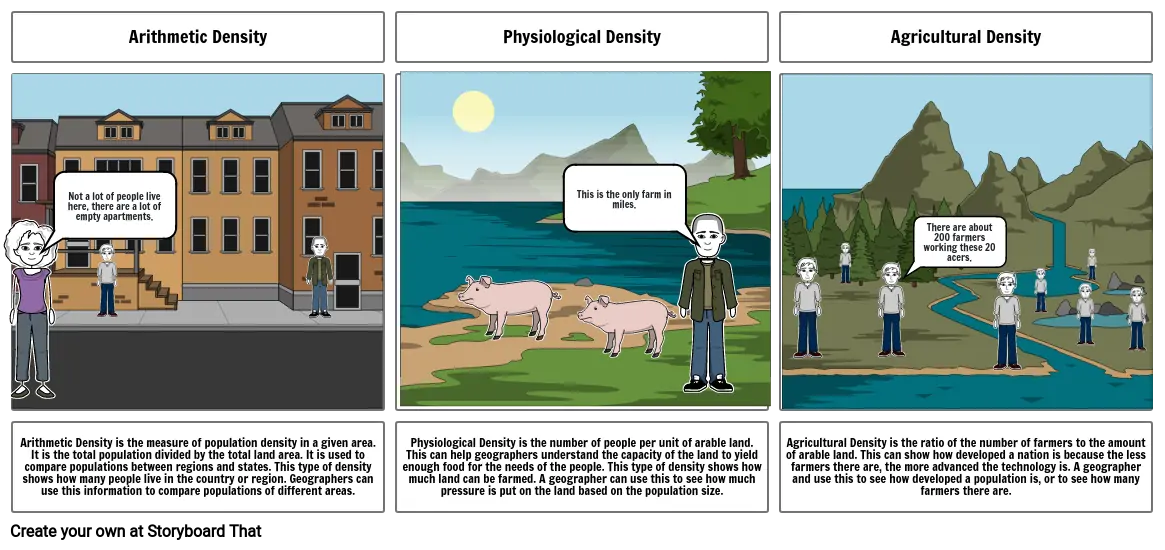
- Arithmetic Density
- Not a lot of people live here, there are a lot of empty apartments.
- Physiological Density
- This is the only farm in miles.
- Agricultural Density
- There are about 200 farmers working these 20 acers.
- Arithmetic Density is the measure of population density in a given area. It is the total population divided by the total land area. It is used to compare populations between regions and states. This type of density shows how many people live in the country or region. Geographers can use this information to compare populations of different areas.
- Physiological Density is the number of people per unit of arable land. This can help geographers understand the capacity of the land to yield enough food for the needs of the people. This type of density shows how much land can be farmed. A geographer can use this to see how much pressure is put on the land based on the population size.
- Agricultural Density is the ratio of the number of farmers to the amount of arable land. This can show how developed a nation is because the less farmers there are, the more advanced the technology is. A geographer and use this to see how developed a population is, or to see how many farmers there are.
Más de 30 millones de guiones gráficos creados

