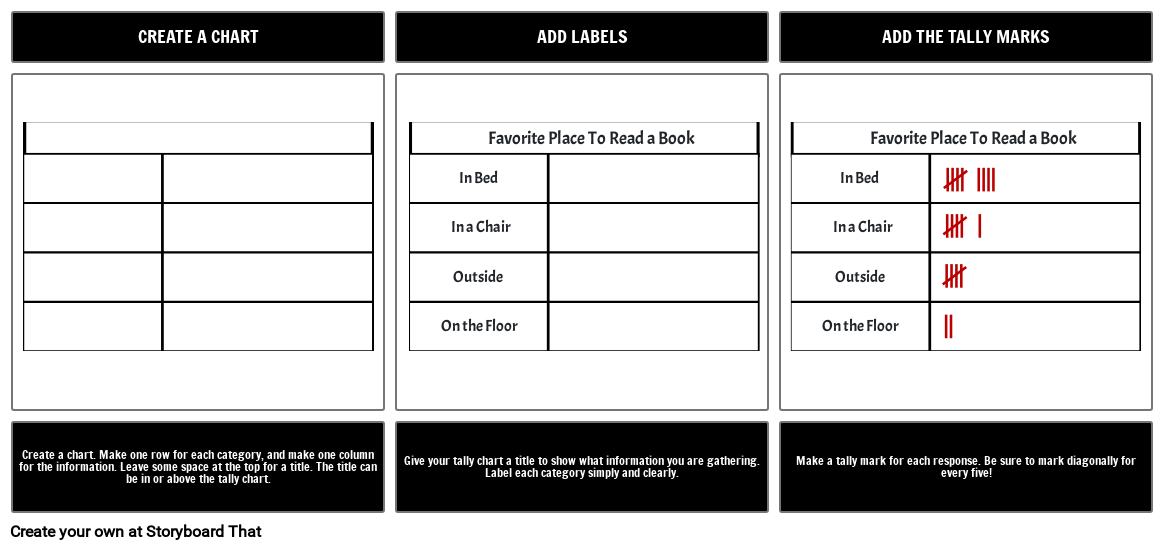
How To Make a Tally Chart

Puedes encontrar este storyboard en los siguientes artículos y recursos:

Enseñando Gráficos de Tiempos con Storyboards
Planes de Lecciones por Anna Warfield
Como educadores, debemos preparar mentes pequeñas para futuros importantes basados en datos. La tabla de conteo es fácil de usar y comprender, por lo que es una excelente opción para los investigadores primerizos. ¡Aprende más con Storyboard That!

Diagrama un Proceso
Planes de Lecciones por Anna Warfield
Las instrucciones y los procesos se entienden mucho más fácilmente cuando se acompañan de imágenes. Cuando hacemos un guión gráfico de un proceso o creamos un diagrama secuencial, podemos centrarnos en pasos discretos, causa y efecto, y secuencia.
'
Storyboard Descripción
Making a tally chart is easy. Make a box, add some labels, and tally ho!
Texto del Guión Gráfico
- CREATE A CHART
- Outside Outside
- In Bed In Bed
- On the Floor On the Floor
- In a Chair In a Chair
- Favorite Place To Read a Book Favorite Place To Read a Book
- ADD LABELS
- ADD THE TALLY MARKS
- Create a chart. Make one row for each category, and make one column for the information. Leave some space at the top for a title. The title can be in or above the tally chart.
- Give your tally chart a title to show what information you are gathering. Label each category simply and clearly.
- Make a tally mark for each response. Be sure to mark diagonally for every five!
Más de 30 millones de guiones gráficos creados
¡Sin Descargas, sin Tarjeta de Crédito y sin Necesidad de Iniciar Sesión Para Probar!


