Equilibrium Lab

Texto del Guión Gráfico
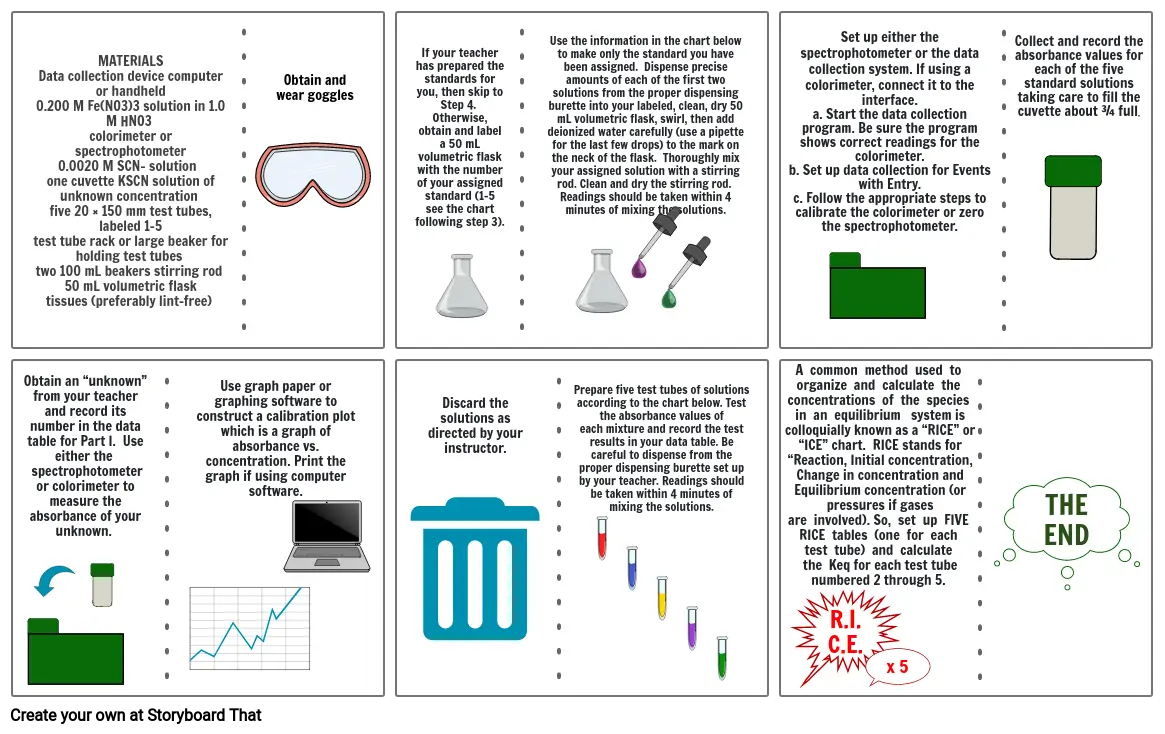
- MATERIALSData collection device computer or handheld 0.200 M Fe(NO3)3 solution in 1.0 M HNO3 colorimeter or spectrophotometer0.0020 M SCN– solution one cuvette KSCN solution of unknown concentration five 20 × 150 mm test tubes, labeled 1-5 test tube rack or large beaker for holding test tubes two 100 mL beakers stirring rod 50 mL volumetric flask tissues (preferably lint-free)
- Obtain and wear goggles
- If your teacher has prepared the standards for you, then skip to Step 4. Otherwise, obtain and label a 50 mL volumetric flask with the number of your assigned standard (1-5 see the chart following step 3).
- Use the information in the chart below to make only the standard you have been assigned. Dispense precise amounts of each of the first two solutions from the proper dispensing burette into your labeled, clean, dry 50 mL volumetric flask, swirl, then add deionized water carefully (use a pipette for the last few drops) to the mark on the neck of the flask. Thoroughly mix your assigned solution with a stirring rod. Clean and dry the stirring rod. Readings should be taken within 4 minutes of mixing the solutions.
- A common method used to organize and calculate the concentrations of the species in an equilibrium system is colloquially known as a “RICE” or “ICE” chart. RICE stands for “Reaction, Initial concentration, Change in concentration and Equilibrium concentration (or pressures if gases are involved). So, set up FIVE RICE tables (one for each test tube) and calculate the Keq for each test tube numbered 2 through 5.
- Set up either the spectrophotometer or the data collection system. If using a colorimeter, connect it to theinterface.a. Start the data collection program. Be sure the program shows correct readings for the colorimeter.b. Set up data collection for Events with Entry.c. Follow the appropriate steps to calibrate the colorimeter or zero the spectrophotometer.
- Collect and record the absorbance values for each of the five standard solutions taking care to fill thecuvette about ¾ full.
- Obtain an “unknown” from your teacher and record its number in the data table for Part I. Use either the spectrophotometer or colorimeter to measure the absorbance of your unknown.
- Use graph paper or graphing software to construct a calibration plot which is a graph of absorbance vs. concentration. Print the graph if using computer software.
- Discard the solutions as directed by your instructor.
- Prepare five test tubes of solutions according to the chart below. Test the absorbance values of each mixture and record the test results in your data table. Be careful to dispense from the proper dispensing burette set up by your teacher. Readings should be taken within 4 minutes of mixing the solutions.
- R.I.C.E.
- x 5
- THEEND
Más de 30 millones de guiones gráficos creados

