Climate

Storyboard-Text
- Climate
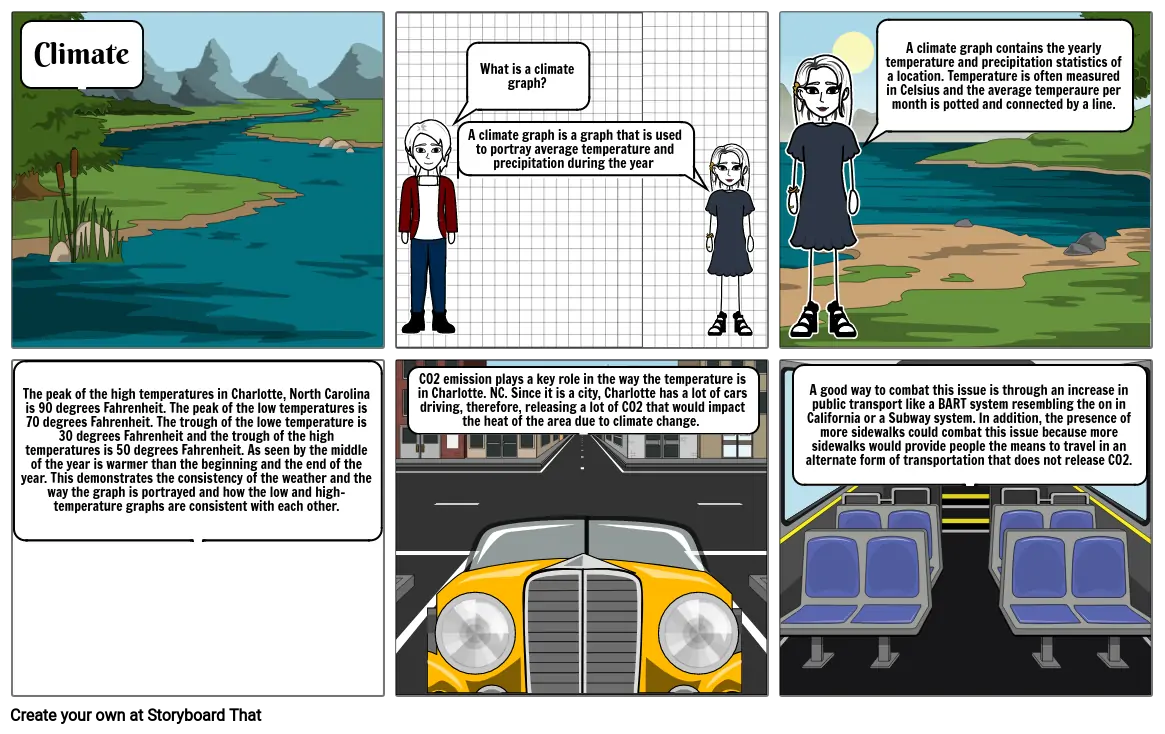
- What is a climate graph?
- A climate graph is a graph that is used to portray average temperature and precipitation during the year
- A climate graph contains the yearly temperature and precipitation statistics of a location. Temperature is often measured in Celsius and the average temperaure per month is potted and connected by a line.
- The peak of the high temperatures in Charlotte, North Carolina is 90 degrees Fahrenheit. The peak of the low temperatures is 70 degrees Fahrenheit. The trough of the lowe temperature is 30 degrees Fahrenheit and the trough of the high temperatures is 50 degrees Fahrenheit. As seen by the middle of the year is warmer than the beginning and the end of the year. This demonstrates the consistency of the weather and the way the graph is portrayed and how the low and high-temperature graphs are consistent with each other.
- CO2 emission plays a key role in the way the temperature is in Charlotte. NC. Since it is a city, Charlotte has a lot of cars driving, therefore, releasing a lot of CO2 that would impact the heat of the area due to climate change.
- A good way to combat this issue is through an increase in public transport like a BART system resembling the on in California or a Subway system. In addition, the presence of more sidewalks could combat this issue because more sidewalks would provide people the means to travel in an alternate form of transportation that does not release CO2.
Über 30 Millionen erstellte Storyboards
Keine Downloads, Keine Kreditkarte und Kein Login zum Ausprobieren Erforderlich!

