Drop out rate of customers - DNA outcome

Storyboard Tekst
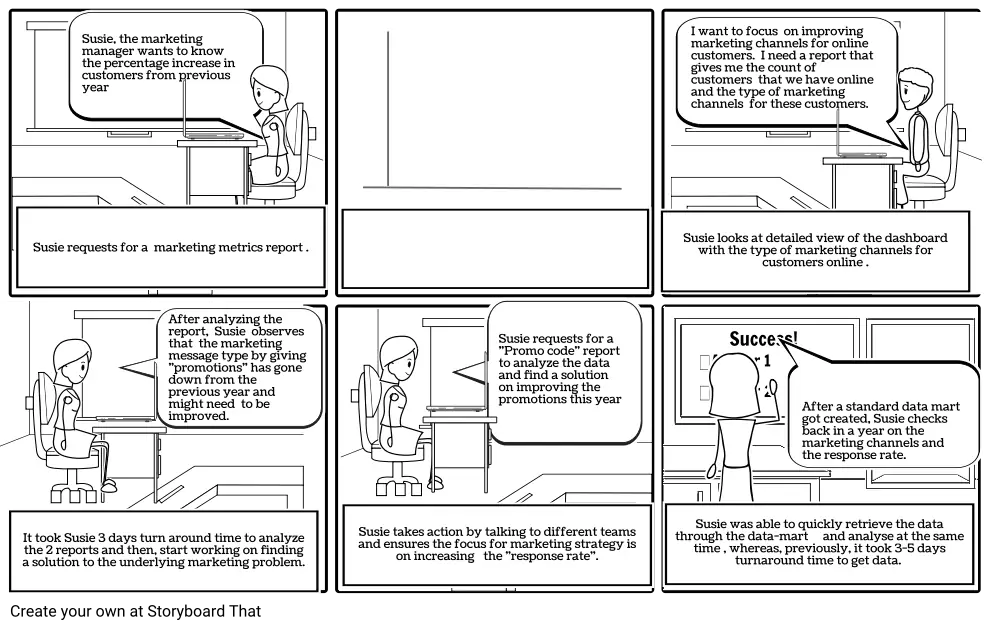
- Susie requests for a marketing metrics report .
-
- Susie, the marketing manager wants to know the percentage increase in customers from previous year
- ATTENTION
- Susie looks at detailed view of the dashboard with the type of marketing channels for customers online .
- I want to focus on improving marketing channels for online customers. I need a report that gives me the count of customers that we have online and the type of marketing channels for these customers.
- Success!
- It took Susie 3 days turn around time to analyze the 2 reports and then, start working on finding a solution to the underlying marketing problem.
- After analyzing the report, Susie observes that the marketing message type by giving "promotions" has gone down from the previous year and might need to be improved.
- Susie takes action by talking to different teams and ensures the focus for marketing strategy is on increasing the "response rate".
- Susie requests for a "Promo code" report to analyze the data and find a solution on improving the promotions this year
- Susie was able to quickly retrieve the data through the data-mart and analyse at the same time , whereas, previously, it took 3-5 days turnaround time to get data.
- Answer 1
- Answer 2
- After a standard data mart got created, Susie checks back in a year on the marketing channels and the response rate.
Over 30 millioner Storyboards oprettet

