learning all about Graphs

Storyboard Tekst
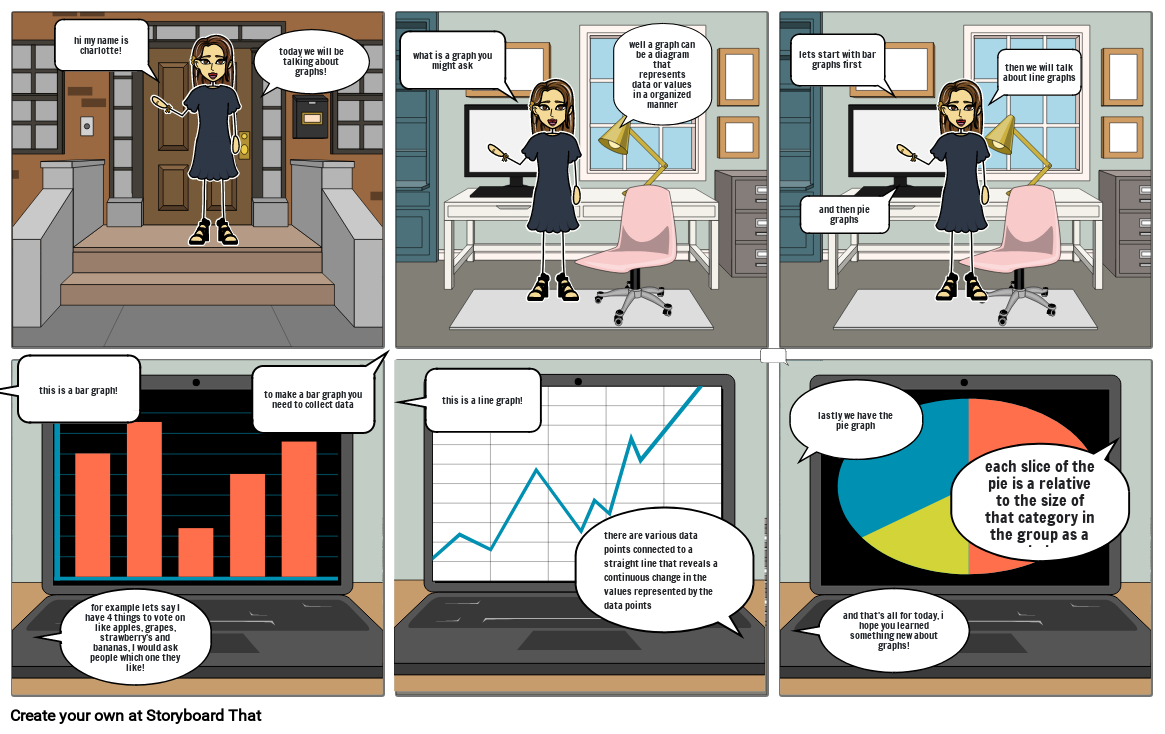
- hi my name is charlotte!
- today we will be talking about graphs!
- what is a graph you might ask
- well a graph can be a diagram that represents data or values in a organized manner
- lets start with bar graphs first
- and then pie graphs
- then we will talk about line graphs
- this is a bar graph!
- for example lets say I have 4 things to vote on like apples, grapes, strawberry's and bananas, I would ask people which one they like!
- to make a bar graph you need to collect data
- this is a line graph!
- there are various data points connected to a straight line that reveals a continuous change in the values represented by the data points
- lastly we have the pie graph
- and that's all for today, i hope you learned something new about graphs!
- each slice of the pie is a relative to the size of that category in the group as a whole.
Over 30 millioner Storyboards oprettet

