Average of companies project

Storyboard Tekst
- The problem
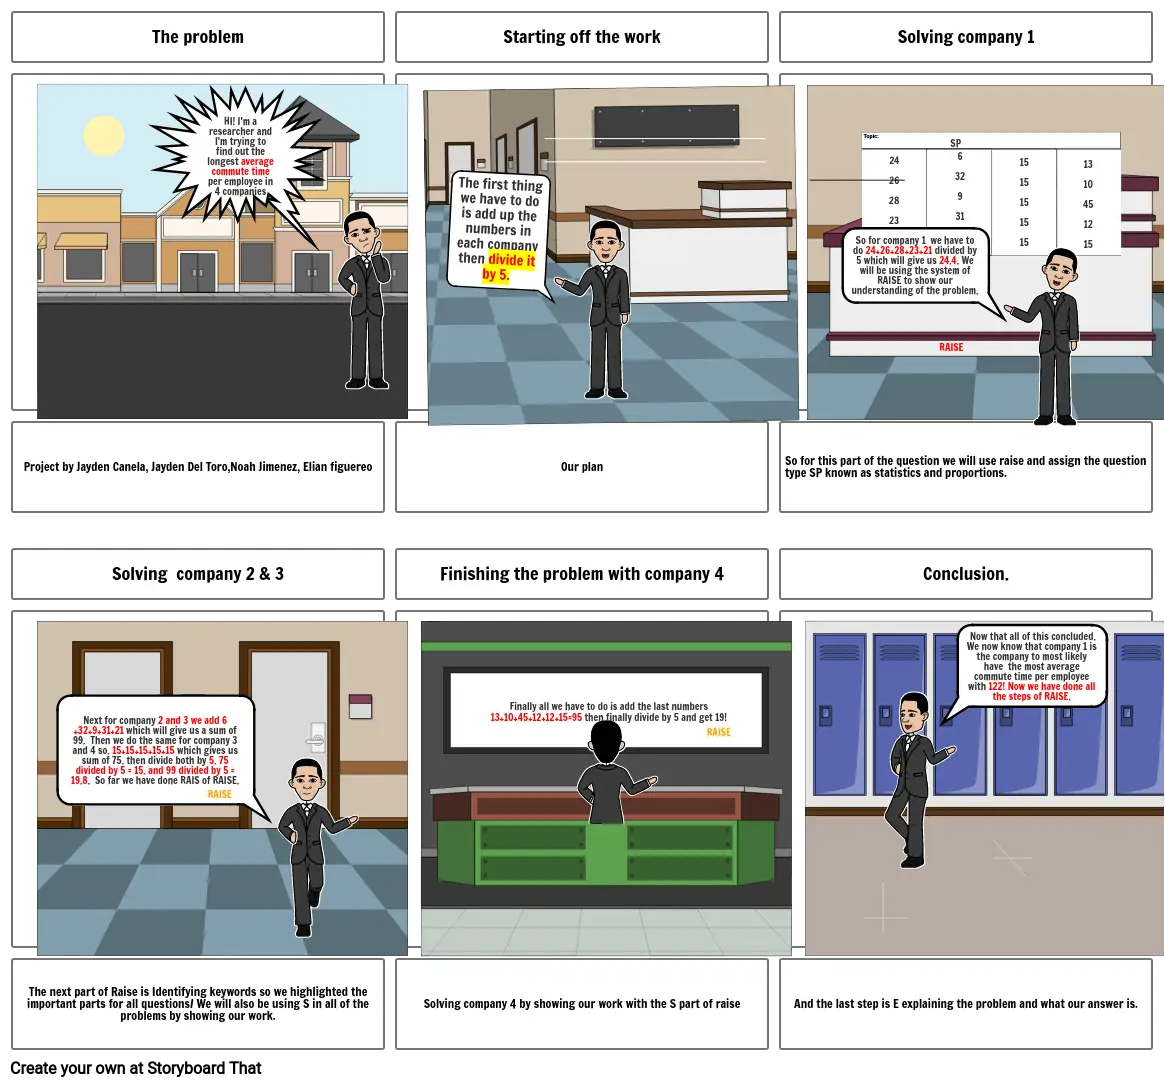
- HI! I'm a researcher and I'm trying to find out the longest average commute time per employee in 4 companies
- Starting off the work
-
- The first thing we have to do is add up the numbers in each company then divide it by 5.
- Solving company 1
- So for company 1 we have to do 24+26+28+23+21 divided by 5 which will give us 24.4. We will be using the system of RAISE to show our understanding of the problem.
- 2426282321
- SP
- RAISE
- 63293121
- 1515151515
- 1310451215
- Project by Jayden Canela, Jayden Del Toro,Noah Jimenez, Elian figuereo
- Solving company 2 & 3
- Next for company 2 and 3 we add 6 +32+9+31+21 which will give us a sum of 99. Then we do the same for company 3 and 4 so. 15+15+15+15+15 which gives us sum of 75. then divide both by 5. 75 divided by 5 = 15. and 99 divided by 5 = 19.8. So far we have done RAIS of RAISE.
- Our plan
- Finishing the problem with company 4
- Finally all we have to do is add the last numbers 13+10+45+12+12+15=95 then finally divide by 5 and get 19!
- RAISE
- So for this part of the question we will use raise and assign the question type SP known as statistics and proportions.
- Conclusion.
- Now that all of this concluded. We now know that company 1 is the company to most likely have the most average commute time per employee with 122! Now we have done all the steps of RAISE.
- The next part of Raise is Identifying keywords so we highlighted the important parts for all questions/ We will also be using S in all of the problems by showing our work.
- RAISE
- Solving company 4 by showing our work with the S part of raise
- And the last step is E explaining the problem and what our answer is.
Over 30 millioner Storyboards oprettet

