
Optimizing Framework Templates for Explaining Test Results

Customers often interact in amazingly creative ways to products and services rather than following your carefully designed plan. There can be unexpected results from various analytical tests, that may not be able to be explained with just numbers. By visually showing the process of what you think is happening, it helps share a hypothesis with others and shed light into what happened during a test. These insights can lead to new products or fundamental changes in your business model. The book Lean Startup by Eric Ries talks about this in length.
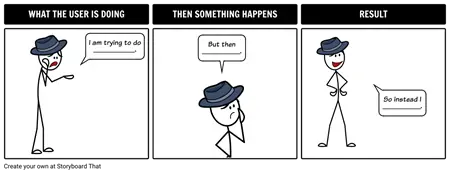
The framework for these is: This – Then That – Result.
- This: What did the user start doing?
- Then That: Then what did they do?
- Result: Consequence of user actions.
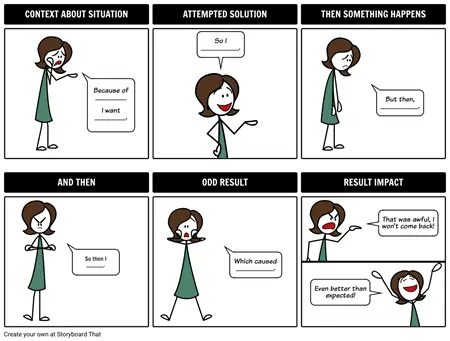
Storyboard Examples

How Tos about Explaining Unexpected Results with Framework Templates
Engage students with interactive storyboard activities that explain test results
Transform test result explanations into interactive learning by having students create their own storyboards. This method helps students visualize the process, understand cause and effect, and develop critical thinking skills.
Introduce the 'This – Then That – Result' framework using real-life classroom examples
Start by sharing relatable scenarios (like a science experiment or math problem) and break them down using the framework. Students will see how actions lead to results, making abstract concepts more concrete.
Guide students to brainstorm and sketch their own storyboards
Encourage students to choose a classroom test or project and outline each step with drawings or digital storyboards. This hands-on approach boosts engagement and supports visual learners.
Facilitate peer sharing and discussion of storyboard explanations
Organize students into pairs or small groups to present their storyboards. Peer feedback sparks new ideas and reinforces understanding through collaboration.
Reflect on how visual storytelling clarifies test outcomes
Wrap up by asking students to share what they learned from visualizing test results. Reflection deepens comprehension and encourages metacognitive skills.
Frequently Asked Questions about Explaining Unexpected Results with Framework Templates
What is a framework template for explaining test results?
A framework template for explaining test results is a structured approach that helps educators and teams clearly communicate test outcomes. It typically breaks down findings into steps like This – Then That – Result to make analysis easy to follow and actionable.
How can I use storyboard examples to explain unexpected test results in class?
You can use storyboard examples to visually map out the sequence of student actions, outcomes, and consequences. This makes it easier for students to understand complex or surprising results, fostering discussion and deeper learning.
Why is visualizing test processes helpful for students?
Visualizing test processes helps students see the steps and logic behind results, making abstract concepts more concrete. This approach encourages engagement and critical thinking, especially when results are not what they expected.
What are the benefits of using 'This – Then That – Result' for lesson planning?
Using the This – Then That – Result structure in lesson planning provides clarity, encourages step-by-step thinking, and helps educators pinpoint where learning gaps or misunderstandings may occur.
Can framework templates be adapted for different grade levels or subjects?
Yes, framework templates are flexible and can be customized for any grade level or subject area. Adjust the complexity of each step to suit your students’ needs and subject matter.
© 2025 - Clever Prototypes, LLC - All rights reserved.
StoryboardThat is a trademark of Clever Prototypes, LLC, and Registered in U.S. Patent and Trademark Office