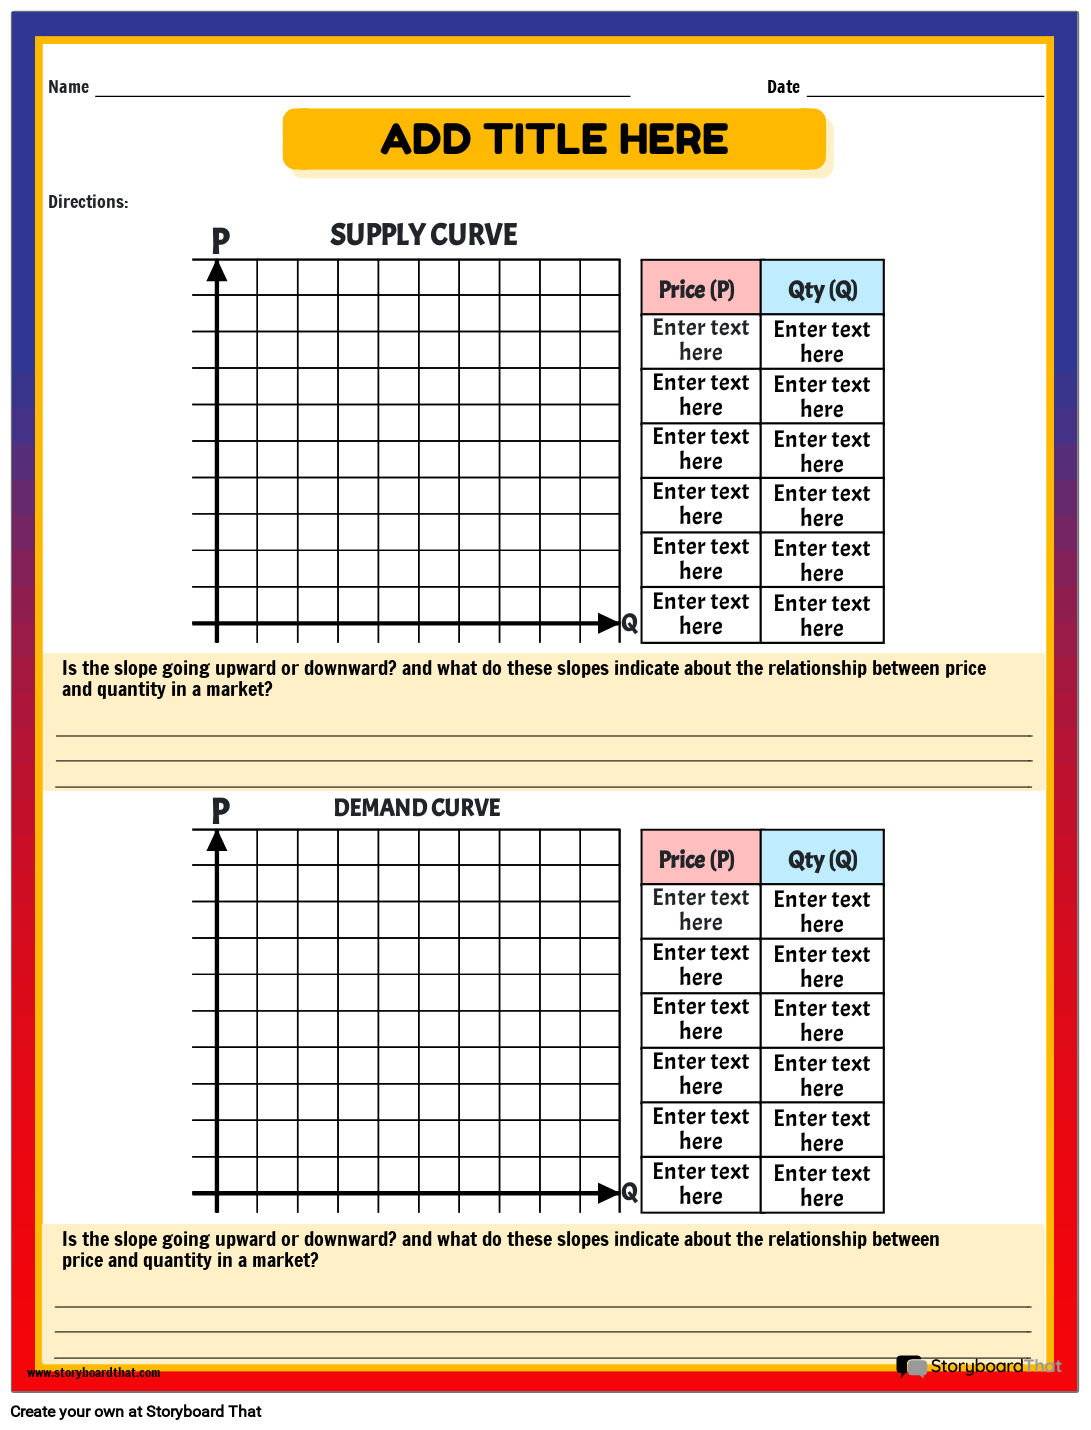
Graphing Supply and Demand Worksheet
Name
Date
Directions:
P
Price (P)
Qty (Q)
SUPPLY CURVE
Q
Enter text here
Enter text here
Enter text here
Enter text here
Enter text here
Enter text here
Enter text here
Enter text here
Enter text here
Enter text here
Enter text here
Enter text here
P
Price (P)
Qty (Q)
DEMAND CURVE
Q
Enter text here
Enter text here
Enter text here
Enter text here
Enter text here
Enter text here
Enter text here
Enter text here
Enter text here
Enter text here
Enter text here
Enter text here
Is the slope going upward or downward? and what do these slopes indicate about the relationship between price and quantity in a market?
Is the slope going upward or downward? and what do these slopes indicate about the relationship between price and quantity in a market?
ADD TITLE HERE
ADD TITLE HERE


