Red & Orange Themed Bar Graph Worksheet Design

You can find this storyboard in the following articles and resources:

Using Storyboard That in Your Math Class
Visual Aids for the Modern Classroom
Storyboard That makes it easy to incorporate visual learning into your math class and have the content tailored to your students. The easily customizable templates allow you to ensure that the worksheets you give to students meets them where they are and challenges the concepts they still are working to master.

Worksheet Template Gallery
Customize Worksheet Templates
View tons of templates for worksheets, flyers, handouts, decorations, task cards, and more!

Bar Graph Worksheets
Customize Bar Graph Worksheets
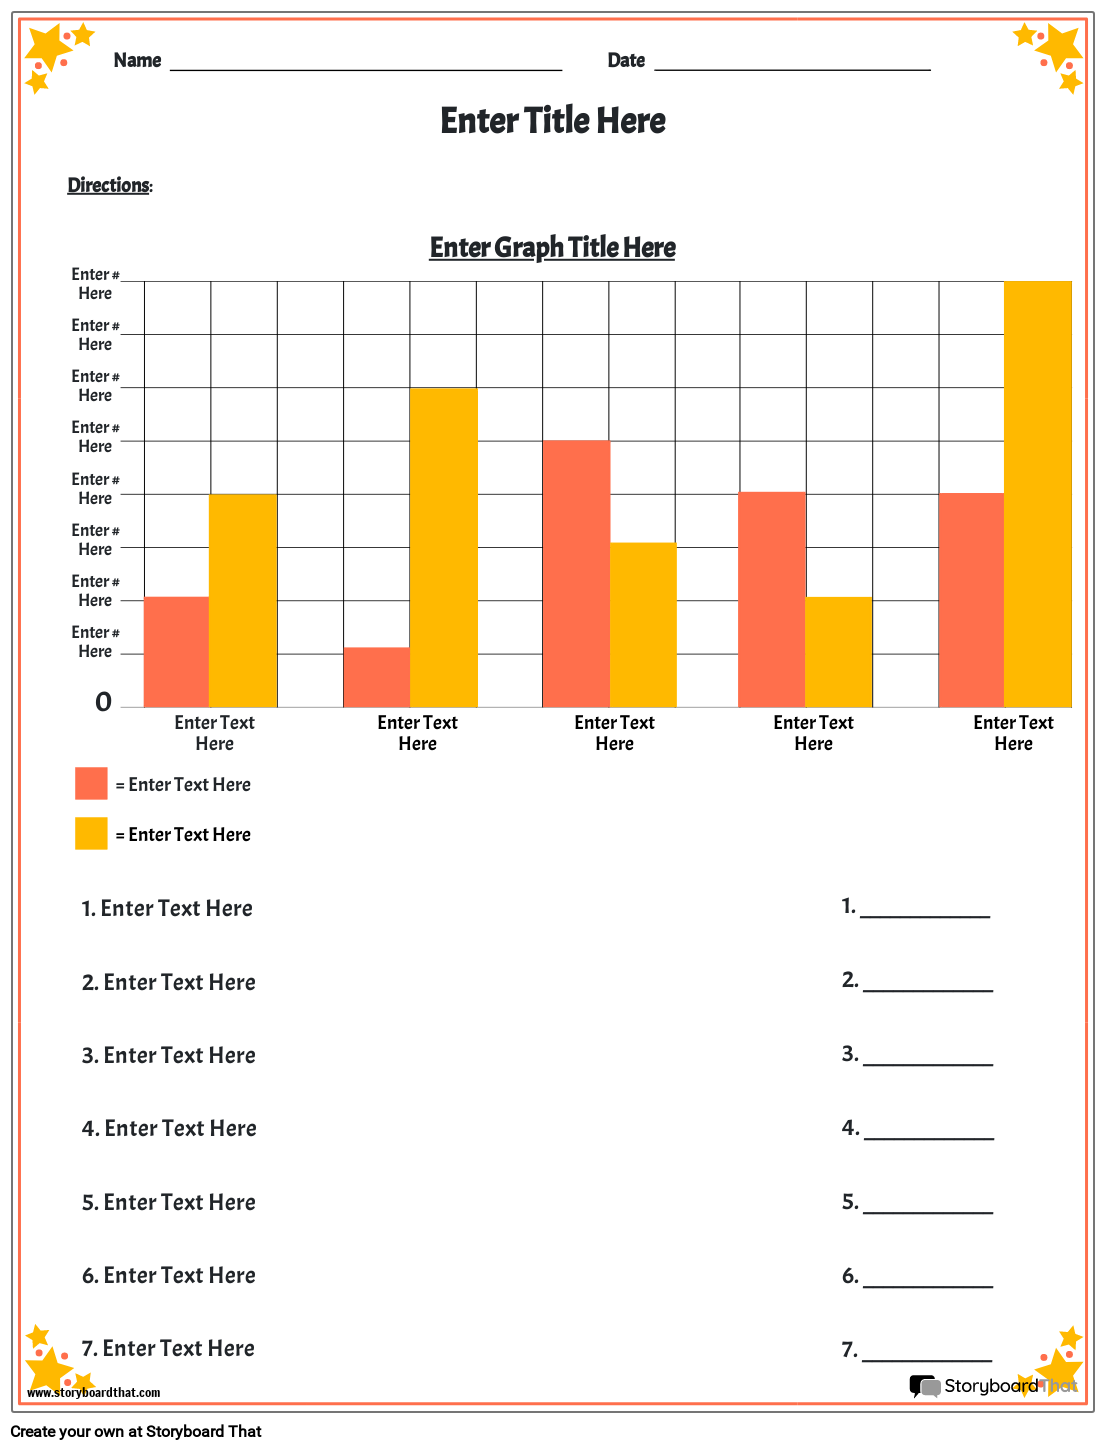
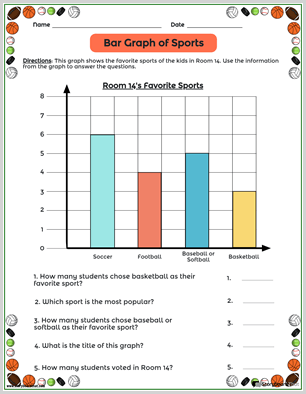
Bar graph worksheets are used to chart categorical data that have been collected by students. Bar graphs can be laid out vertically or horizontally, and represent data in the form of a rectangular bar across the graph.

Graph Worksheet Templates
Customize Graph Templates
Create custom graphing worksheets to help students plot or interpret data!
'
Check out some of our other educational articles!
Storyboard Text
- Name Date
- Enter # Here
- Enter # Here
- Enter # Here
- Enter # Here
- Enter # Here
- Enter # Here
- Enter # Here
- Enter # Here
- Directions:
- 0
- 1. Enter Text Here
- 2. Enter Text Here
- = Enter Text Here
- = Enter Text Here
- Enter Text Here
- Enter Title Here
- Enter Text Here
- Enter Graph Title Here
- Enter Text Here
- Enter Text Here
- 1. _____________
- 2. _____________
- Enter Text Here
- 3. Enter Text Here
- 4. Enter Text Here
- 5. Enter Text Here
- 6. Enter Text Here
- 7. Enter Text Here
- 3. _____________
- 4. _____________
- 5. _____________
- 6. _____________
- 7. _____________
Over 30 Million Storyboards Created


